Home / Research Tools
Research Tools
| | Corporate Profile: Osisko Mining Corp
Publisher: Kaiser Research Online
Author: Copyright 2009 John A Kaiser
|
| |
Osisko Mining Corp (OSK-T)
| Osisko is a Canada-focused mining company operating its Canadian Malartic project in Quebec's Abitibi Belt since April 2011 under the leadership of CEO Sean Roosen. Canadian Malartic is a past-producing property the company acquired in 2004, and has since established open-pittable Proven and Probable Reserves of 10.7 million ounces of gold. In August 2011 the company acquired a second advanced gold project through the acquisition of Brett Resources and the company's 6.6 million inferred gold ounce Hammond Reef project. Osisko has also optioned a number of early stage gold exploration projects in Ontario and Quebec as it attempts to develop a fuller project pipeline. In November 2013 the company announced production of its one millionth gold ounce at the Canadian Malartic mine, and shortly thereafter in January 2014 Osisko received an unsolicited takeover offer from Goldcorp of $2.26 cash and ).146 ofa Goldcorp share per Osisko share, roughly a $2.6 billion value at the time of the offer. In April 2014 a counteroffer appeared from Yamana Gold, which agreed to acquire 50% of Osisko's assets for $441 million in cash and $929 million in Yamana shares. An additional agreement to sell a metals stream on the Canadian Malartic mine provides an additional $550 million in cash to be distributed to Osisko shareholders. Later in April, Goldcorp subsequently increased its bid to the equivalent of $7.65 per share in cash and stock. In turn, Yamana returned with a joint offer with Agnico Eagle, valueing Osisko at $3.9 billion, roughly $8.15 per share, including the value of New Osisko shares which will hold the company's Mexican properties and some cash. |
Key to Understanding IPV Charts and Spec Value Hunter Tables
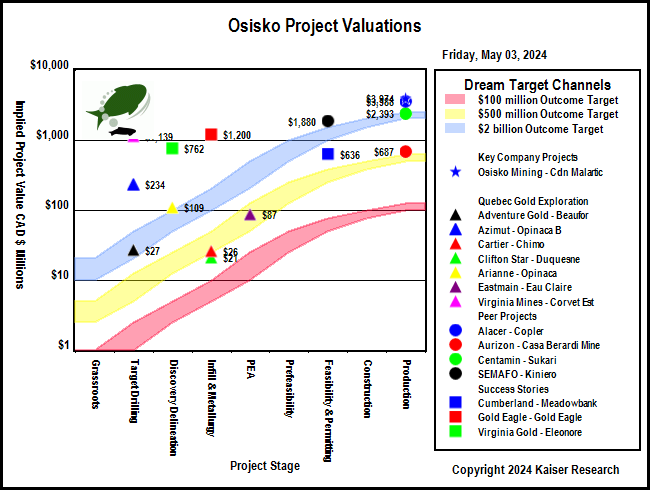
| An IPV Chart is a graphical presentation of a Spec Value Hunter table that has been constructed according to the Rational Speculation Model developed by John Kaiser. The IPV Chart allows speculators to identify which projects offer poor, fair or good speculative value in both absolute and relative terms. The speculative value depends on the project stage, the project's implied value as calculated by the company's fully diluted capitalization, stock price and net project interest, and the dream target deemed appropriate for the project. A dream target is what a project would be worth in discounted cash flow terms once in production. |
| Green background indicates the dream target judged appropriate for this play by John Kaiser - otherwise unranked. |
Poor Speculative Value -   |
Fair Speculative Value -  |
Good Speculative Value -   |
| Note: narrow arrows indicate IPV is outside the fair value channel but within 25% of the fair value limits |
| Click on the company name to view the company profile, the project name to view project details. |
| Click on the project icon if its background is shaded to get the IPV Chart for that company. |
| Cdn Malartic |  | 100% WI | Canada | 9-Production |
|---|
| Canadian Malartic 43-101 Economic Study (USD except where noted otherwise) |
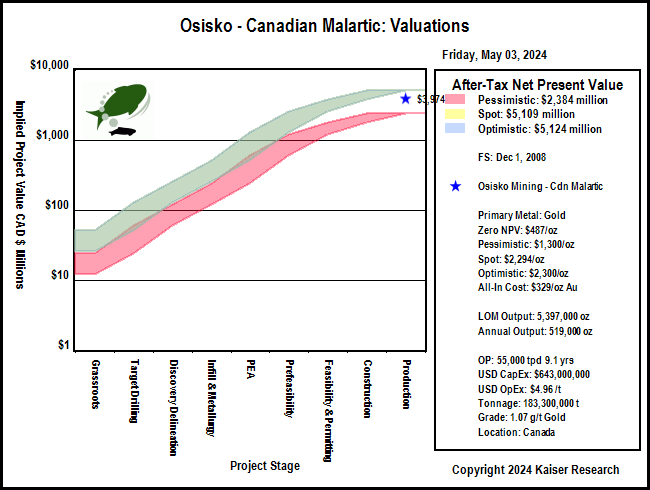
| FS | Dec 1, 2008 |
| Micon Intl. | Canadian Malartic |
| Mining Scenario | TR | Mining Costs |
| Mining Type: | OP |
| Cost Currency: | USD |
| Processing Type: | cyanidatio |
| Capital Cost: | $643,000,000 |
| Operating Rate: | 55,000 tpd |
| Sustaining Cost: | $95,000,000 |
| Operating Days: | 365 |
| Operating Cost: | $4.96/t |
| Strip Rate: | 1.8 |
| BC Cash Cost per Unit: USD | $192/oz Au |
| Mine Life: | 9 years |
| BC Cash Cost Net By-Products: USD | $192/oz Au |
| LOM Tonnage: | 183,300,000 t |
| BC All-In Cost Net By-Prod: USD | $329/oz Au |
| Est Startup: |
|
| Spot All-In Cost Net By-Prod: USD | $329/oz Au |
| Production Potential |
| Metal 1 | Metal 2 | Metal 3 | Metal 4 |
| Metal: | Au |
|
|
|
| Grade: | 1.07 g/t | 1.69 |
|
|
| Recovery: | 85.0% | 70.0% |
|
|
| Annual Output: | 519,000 oz | 754,000 |
|
|
| LOM Output: | 5,397,000 oz | 6,861,400 |
|
|
| Base Case Price: | $775/oz |
|
|
|
| Spot Price: | $1,315/oz |
|
|
|
| Base Case NSR: | $20.04/t | /t |
|
|
| Spot NSR: | $34.00/t | $0.00/t |
|
|
| Base Case Valuation |
| Reported Valuation Currency: | USD |
| Pre-Tax NPV: | $1,001,400,000 |
| Discount Rate: | 5% |
| After-Tax NPV: | $730,700,000 |
| Total Base Case NSR USD: | $20.04/t |
| Pre-Tax IRR: | 29% |
| Total Spot NSR USD: | $34.00/t |
| After-Tax IRR: | 25% |
| Annual Pre-Tax Cash Flow Base Case and Net CF/FDSH USD: | $302,653,000 | $0.63 | Pre-Tax Payback: |
|
| Annual Pre-Tax Cash Flow Spot and Net CF/FDSH USD: | $582,938,950 | $1.24 | After-Tax Payback: | 3.0 y |
| Enterprise Value CAD : | $4,270,612,559 | $9.28/sh | Share Price: | $8.64 |
| Note: |
| Comparative Valuations using Life of Mine Averages |
| Discount Rate: | 0% | 5% | 10% | 15% |
| Base Case Pre-Tax NPV USD: | $1,985,877,000 | $1,364,930,045 | $944,723,763 | $652,841,277 |
| Base Case Pre-Tax Net NPV/Sh USD: | $4.32 | $2.97 | $2.05 | $1.42 |
| Premium BC PT NPV over EV: | ($2.90) | ($4.25) | ($5.16) | ($5.80) |
| Spot Pre-Tax NPV USD: | $4,508,450,550 | $3,262,284,855 | $2,412,154,182 | $1,815,804,696 |
| Spot Pre-Tax Net NPV/Sh: | $9.80 | $7.09 | $5.24 | $3.95 |
| Premium Spot PT NPV over EV USD: | $2.58 | ($0.13) | ($1.97) | ($3.27) |
| The comparative NPV calculations assume constant annual cash flow based on the life of mine average annual payable production and CapEx spent in year one. The operating cost includes the LOM sustaining capital. Due to details such as ore scheduling these NPV figures may differ from those of the 43-101 economic study. |
| After-Tax Valuations using Spot By-Product Prices |
 |
 |
| Canadian Malartic 43-101 Economic Study (USD except where noted otherwise) |
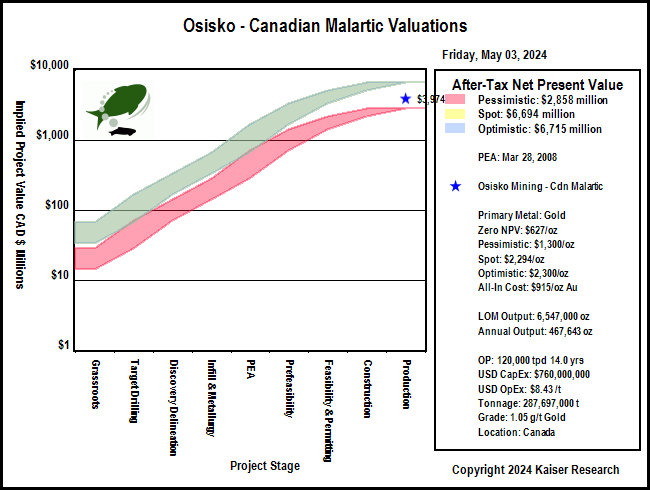
| PEA | Mar 28, 2008 |
| BBA Inc | Canadian Malartic |
| Mining Scenario | TR | Mining Costs |
| Mining Type: | OP |
| Cost Currency: | USD |
| Processing Type: | carbon in |
| Capital Cost: | $760,000,000 |
| Operating Rate: | 120,000 tpd |
| Sustaining Cost: | $58,760,000 |
| Operating Days: | 365 |
| Operating Cost: | $8.43/t |
| Strip Rate: | 1.8 |
| BC Cash Cost per Unit: USD | $790/oz Au |
| Mine Life: | 14 years |
| BC Cash Cost Net By-Products: USD | $790/oz Au |
| LOM Tonnage: | 287,697,000 t |
| BC All-In Cost Net By-Prod: USD | $915/oz Au |
| Est Startup: |
|
| Spot All-In Cost Net By-Prod: USD | $915/oz Au |
| Production Potential |
| Metal 1 | Metal 2 | Metal 3 | Metal 4 |
| Metal: | Au |
|
|
|
| Grade: | 1.05 g/t |
|
|
|
| Recovery: | 84.0% |
|
|
|
| Annual Output: | 467,643 oz |
|
|
|
| LOM Output: | 6,547,000 oz |
|
|
|
| Base Case Price: | $775/oz |
|
|
|
| Spot Price: | $1,315/oz |
|
|
|
| Base Case NSR: | $8.27/t |
|
|
|
| Spot NSR: | $14.04/t |
|
|
|
| Base Case Valuation |
| Reported Valuation Currency: | USD |
| Pre-Tax NPV: | $1,001,000,000 |
| Discount Rate: | 5% |
| After-Tax NPV: |
|
| Total Base Case NSR USD: | $8.27/t |
| Pre-Tax IRR: | 22% |
| Total Spot NSR USD: | $14.04/t |
| After-Tax IRR: |
|
| Annual Pre-Tax Cash Flow Base Case and Net CF/FDSH USD: | ($6,810,675) | ($0.02) | Pre-Tax Payback: | 3.2 y |
| Annual Pre-Tax Cash Flow Spot and Net CF/FDSH USD: | $245,739,927 | $0.53 | After-Tax Payback: |
|
| Enterprise Value CAD : | $4,270,612,559 | $9.28/sh | Share Price: | $8.64 |
| Note: Capex equals $146 per recoverable ounce |
| Comparative Valuations using Life of Mine Averages |
| Discount Rate: | 0% | 5% | 10% | 15% |
| Base Case Pre-Tax NPV USD: | ($914,109,450) | ($827,583,273) | ($764,628,322) | ($715,664,335) |
| Base Case Pre-Tax Net NPV/Sh USD: | ($1.99) | ($1.80) | ($1.66) | ($1.56) |
| Premium BC PT NPV over EV: | ($9.21) | ($9.02) | ($8.88) | ($8.77) |
| Spot Pre-Tax NPV USD: | $2,621,598,980 | $1,553,281,232 | $926,700,181 | $541,483,285 |
| Spot Pre-Tax Net NPV/Sh: | $5.70 | $3.38 | $2.01 | $1.18 |
| Premium Spot PT NPV over EV USD: | ($1.52) | ($3.84) | ($5.20) | ($6.04) |
| The comparative NPV calculations assume constant annual cash flow based on the life of mine average annual payable production and CapEx spent in year one. The operating cost includes the LOM sustaining capital. Due to details such as ore scheduling these NPV figures may differ from those of the 43-101 economic study. |
| After-Tax Valuations using Spot By-Product Prices |
 |
 |
|
| |
| | You can return to the Top of this page
|
|