Home / Companies / KRO Focus
KRO Focus
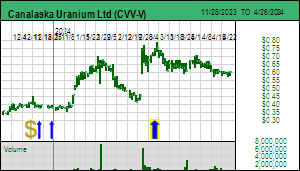
| Outcome Visualization Project as of Apr 23, 2024: Canalaska:- West McArthur as McArthur River Clone |
| Project: | West McArthur | Location: | Canada | Stage: | 3-Discovery Delineation |
| Net Interest: | 83.3% WI | Uncapped NSR: | 8.3% | Target Metals: | Uranium |
| OV Project ID: | 1000009 | OVP Posted: | 5/17/2016 | OVP Retired: |
|
| Current OV ID: | 1000035 | Current OV Confirmed: | 3/8/2024 | Visualizer: | JK |
Issued
153,618,000 |
Price
$0.600 |
Working Capital
$15,076,000 |
Key People: Cory Belyk (CEO), Thomas Jr Graham (Chair), Harry Chan (CFO), Nathan Bridge (VP EX), Dianne M. Szigety (Sec), |
Diluted
212,149,000 |
Insiders
3.0% |
As of
1/31/2024 |
 |  |
| Visualized Outcome: Canalaska - West McArthur as McArthur River Clone |
| Canalaska Uranium Ltd announced a basement hosted intersection on July 15, 2022 while testing a conductor southwest of the 42 Zone which has sandstone hosted mineralization related to the structure that hosts the Fox Lake zone owned by Cameco and Orano. The Fox Lake deposits are about 400,000 tonnes of 7.99% U3O8. An OV created for West McArthur in 2016 visualized a McArthur River clone and used costs provided by Cameco in a 2012 43-101 report. McArthur River is mined at only 200 tpd because it is about 1 million tonnes of 16% and located at the unconformity which creates difficult mining conditions that entail very high costs. In February 2024 Canalaska announced a substantial very high grade intersection at the unconformity after struggling during 2023 to define the geometry of the basement hosted mineralization encountered in 2022. The unconformity intersection will simplify delineation drilling of what may prove to be a "string of pearls" similar to the McArthur egress-style zones. This OV has been updated with an across the board 25% cost escalation of the costs used in 2016. |
| Source Note: The costs used in the original 2016 OV were based on CAD costs used by Cameco for Cigar Lake and McArthur River. For the 2024 OV update all costs have been increased by 25%. |
| Visualized Outcome Summary: Canalaska - West McArthur as McArthur River Clone |
| Deposit Scenario: 1,062,200 t @ 16.46% Uranium |
| Mining Scenario: Underground 200 tpd 14.6 yrs, CapEx $1.9 billion, SustCapEx $649.0 million, OpEx $6,753.75/t (USD), AISC $9,111.90/t (USD) |
| LOM Payable: 380.0 million lb U3O8 uranium |
| Economic Value (after-tax): IRR 53.5%, Payback 1.9 yrs, NPV at 8.0% - USD $5,942,101,782, Future Price/sh: CAD $31.90 |
| Economic Outcome - Discount Rate: 8.0% - CAD AT NPV: $8.1 billion - Good Speculative Value |
| Gross Rock Value (USD/t): | $32,296 | Recoverable Rock Value: | $31,876 | Payable Rock Value: | $31,766 |
| LOM CapEx & Sustaining Cost: | $2,504,824,106 | LOM Operating Cost: | $7,173,831,082 | AISC per tonne: | $9,111.90 |
| LOM Net Payable Revenue (USD): | $30,958,446,530 | LOM PT Cash Flow (USD): | $23,242,193,551 | LOM AT Cash Flow (USD): | $14,248,409,070 |
| USD Pre-Tax NPV: | $10,761,719,867 | Pre-Tax IRR: | 87.4% | Pre-Tax Payback: | 1.1 |
| USD After-Tax NPV: | $5,942,101,782 | After-Tax IRR: | 53.5% | After-Tax Payback: | 1.9 |
| CAD Fair Spec Value Low: | $203,115,894 | CAD Fair Spec Value High: | $406,231,788 | CAD Implied Project Value: | $152,826,750 |
| Price Target if Visualized Outcome delivered by Expl-Dev Cycle without dilution: CAD $31.90 |
| Economic Outcome (USD): Revenue Model at OV designated Metal Prices |
| Annual Average | Life of Mine (LOM) | LOM Stats |
| Recoverable Revenue: | $2,326,963,941 | $33,858,919,148 | $31,876/t ore Recoverable Value: |
| Smelter/Transport Costs: | ($8,023,203) | ($116,743,094) | 0.3% of Recoverable Revenue |
| Gross Payable Revenue: | $2,318,940,738 | $33,742,176,054 | 99.7% of Recoverable Revenue |
| Royalties: | ($191,312,611) | ($2,783,729,524) | 8.3% of Gross Payable Revenue |
| Net Payable Revenue: | $2,127,628,127 | $30,958,446,530 | 91.4% of Recoverable Revenue |
| Mining Cost: | ($240,254,516) | ($3,495,867,769) | 45% of OpEx - $3,291.16/t ore |
| Processing Cost: | ($213,559,570) | ($3,107,438,017) | 40% of OpEx - $2,925.47/t ore |
| Other Cost: | ($32,033,935) | ($466,115,702) | 6% of OpEx - $438.82/t ore |
| Sustaining Cost: | ($42,663,156) | ($639,947,341) | 8% of OpEx - $602.47/t ore |
| Total Operating Cost: | ($528,984,293) | ($7,716,252,978) | 25% of Net Payable Revenue - OpEx - $7,264.41/t ore |
| Pre-Tax Cash Flow: | $1,598,643,834 | $23,242,193,551 | 75% of Net Payable Revenue - $21,881.18/t ore |
| Taxes: | ($618,653,733) | ($8,993,784,482) | 39% of Pre-Tax Cash Flow - $8,467.13/t ore
|
| After-Tax Cash Flow: | $979,990,102 | $14,248,409,070 | 46% of Net Payable Revenue - $13,414.05/t ore |
| Note: Concentrate transport costs, smelter treatment costs and retention are subtracted from recoverable revenue to get gross payable revenue to which the uncapped royalty rate for the project is applied. The annual average of LOM sustaining cost is expensed as an annual operating cost. Annual average figures reflect full production years. |
| Economic Outcome (USD): Royalty Model for 1% NSR at OV designated Metal Prices |
| Mine Life: | 15 years | Startup | NPV 5% | NPV 10% | NPV 15% |
| Annual Avg NSR: | $21,276,281 | Now | $205,944,875 | $145,036,871 | $107,161,261 |
| LOM NSR: | $309,584,465 | 2030 | $153,679,237 | $81,869,532 | $46,328,770 |
 |
| Fair Speculative Value Stock Price Range: CAD $0.80 - $1.59 |
| MSV (Market Cycle S Curve): Market Speculative Value represents the typical market pricing pattern of a new discovery as it moves through its exploration-development cycle. The irrational pricing behavior of the yellow channel contrasts with the fair speculative value of the blue channel as defined by the rational speculation model because during the pre-economic study stages there is great uncertainty about how big the discovery will turn out. |
Fair Speculative Value Ladder
| USD OV NPV | CAD OV NPV | Exch Rate | Diluted | Net Interest |
|---|
| $5,942,101,782 | $8,124,635,766 | 1.3673 | 212,149,000 | 83.29% |
|---|
| Project Stage | Uncertainty Range | CAD FSV Range | CAD FSV per Share Range | CAD MSV per Share Range |
|---|
| Grassroots |
0.5% - 1.0% |
$40,623,179 - $81,246,358 |
$0.16 - $0.32 |
$0.32 - $0.80 |
| Target Drilling |
1.0% - 2.5% |
$81,246,358 - $203,115,894 |
$0.32 - $0.80 |
$0.80 - $1.59 |
| Discovery Delineation |
2.5% - 5.0% |
$203,115,894 - $406,231,788 |
$0.80 - $1.59 |
$1.59 - $23.92 |
| Infill & Metallurgy |
5% - 10% |
$406,231,788 - $812,463,577 |
$1.59 - $3.19 |
$15.95 - $31.90 |
| PEA |
10% - 25% |
$812,463,577 - $2,031,158,942 |
$3.19 - $7.97 |
$7.97 - $23.92 |
| Prefeasibility |
25% - 50% |
$2,031,158,942 - $4,062,317,883 |
$7.97 - $15.95 |
$7.97 - $15.95 |
| Permitting & Feasibility |
50% - 75% |
$4,062,317,883 - $6,093,476,825 |
$15.95 - $23.92 |
$7.97 - $15.95 |
| Construction |
75% - 100% |
$6,093,476,825 - $8,124,635,766 |
$23.92 - $31.90 |
$15.95 - $23.92 |
| Production |
100% |
$8,124,635,766 |
$31.90 |
$31.90 - $39.87 |
 |
| Market Speculative Value Stock Price Range: CAD $1.59 - $23.92 |
| Warning: while the market spec value (S-Curve) and fair spec value channels presented in project value terms track the evolving expected ultimate outcome value, when presented in stock price terms the expected stock prices are subject to dilution through future equity financings or project interest farmouts. |
| Alternative Metal Price Scenarios |
| Metal 1 | Metal 2 | Metal 3 | Metal 4 |
| Uranium |
|
|
|
| Spot: | $89.00 /lb U3O8 |
|
|
| | OV Assigned: | $89.00 /lb U3O8 |
|
|
| | Pessimistic: | $50.00 /lb U3O8 |
|
|
| | Optimistic: | $125.00 /lb U3O8 |
|
|
| | Fantasy: | $200.00 /lb U3O8 |
|
|
| | Note: for Metal 1 pessimistic, optimistic and fantasy price scenarios, OV assigned prices are used for Metals 2-4 |
| Economic Outcomes with Alternative Metal Price Scenarios |
| USD PT NPV | USD PT IRR | USD AT NPV | USD AT IRR | AT Payback yrs |
| Spot: | $10,761,719,867 | 87.4% | $5,942,101,782 | 53.5% | 1.9 |
| OV Assigned: | $10,761,719,867 | 87.4% | $5,942,101,782 | 53.5% | 1.9 |
| Pessimistic: | $3,469,713,767 | 35.8% | $1,712,738,244 | 22.7% | 4.2 |
| Optimistic: | $17,492,802,421 | 134.7% | $9,846,129,663 | 81.0% | 1.2 |
| Fantasy: | $31,515,891,076 | 233.1% | $17,979,521,083 | 138.1% | 0.7 |
| Fair Speculative Value for Alternative Metal Price Scenarios |
| Stage: Discovery Delineation - 2.5% - 5.0% |
| CAD AT NPV | CAD Target Price | CAD FSV Range | CAD FSV per Share Range | CAD MSV per Share Range |
| Spot: | $8,124,635,766 | $31.90 | $203,115,894 - $406,231,788 | $0.80 - $1.59 | $1.59 - $23.92 |
| OV Assigned: | $8,124,635,766 | $31.90 | $203,115,894 - $406,231,788 | $0.80 - $1.59 | $1.59 - $23.92 |
| Pessimistic: | $2,341,827,001 | $9.19 | $58,545,675 - $117,091,350 | $0.23 - $0.46 | $0.46 - $6.90 |
| Optimistic: | $13,462,613,089 | $52.85 | $336,565,327 - $673,130,654 | $1.32 - $2.64 | $2.64 - $39.64 |
| Fantasy: | $24,583,399,177 | $96.51 | $614,584,979 - $1,229,169,959 | $2.41 - $4.83 | $4.83 - $72.39 |
| Detailed Visualized Outcome (KRO Members Only) |
| VU = Very Unsure |
SU = Somewhat Unsure |
SS = Somewhat Sure |
VS = Very Sure |
| The confidence indicator is intended to convey the visualizer's degree of uncertainty with regard to a particular assumption. |
| Deposit Scenario |
| Metal 1 | Metal 2 | Metal 3 | Metal 4 |
| Uranium
U |
|
|
|
| Grade: | 16.46% | SS | |
| |
| |
|
| Recovery: | 98.7% | VU |
|
|
|
|
|
|
| Payable: | 100.0% | VS |
|
|
|
|
|
|
| Concentrate Grade: | 100.0% | VS |
|
| Price: | $89.00 /lb U3O8 | SS | |
| |
| |
|
| Price Type: | Spot |
|
|
|
|
|
|
|
| Annual Payable: | 26,145,662 lb U3O8 |
|
|
|
|
|
|
|
| LOM Payable: | 380,437,294 lb U3O8 |
|
|
|
|
|
|
|
| Metal 1 Price Note: The uranium price was abnormally low after Fukushima in 2011 which prompted Germany to abandon nuclear energy and suspended Japanase nuclear power generation. The result was utility de-stockpiling that has run its course. At the same time Kazakhstan ramped up ISL output to become the dominant producer and its capacity expansion potential appears to have plateaued. Meanwhile Chinese reactors are coming on line. U3O8 needs an $80/lb floor for new supply to be viable. |
| Mining Scenario |
| Tonnage: | 1,062,200 | SS | Strip Rate: | 0.0 | VU |
| Operating Rate (tpd): | 200 | SS | Mining Type: | Underground | VS |
| Mine Life (years): | 14.6 |
| Startup: | 2030 | SU |
| Tax Treatment: | SLM Straight Line Depreciation | SU | Tax Rate: | 42.0% | SS |
| Tonnage Note: Based on the original resource for McArthur River and the CAD costs outlined in the November 2012 43-101 technical report for McArthur River, which for the 2024 OV Update have been escalated by 25%.. |
| Mining Type Note: Deep highly reactive uranium deposits at the unconformity are mined underground using local freezing to contain water flow and remote controlled equipment. |
| Tax Rate Note: 15% federal, 12% provincial, and 15% "upper tier "profit royalty". |
| Cost Scenario |
| Currency | USD Cost | Exchange Rate |
| CapEx: | $2,500,000,000 | SU | CAD | $1,855,425,263 | 1.347 |
| Sustaining Capital: | $875,000,000 | SU | CAD | $649,398,842 | 1.347 |
| Mining Cost ($/t rock): | $4,500.00 | SU | CAD | $3,339.77 | 1.347 |
| Mining Cost ($/t ore): | $4,500.00 |
| CAD | $3,339.77 | 1.347 |
| Processing Cost ($/t): | $4,000.00 | SU | CAD | $2,968.68 | 1.347 |
| Other Cost ($/t): | $600.00 | SU | CAD | $445.30 | 1.347 |
| Total OpEx ($/t): | $9,100.00 |
| CAD | $6,753.75 | 1.347 |
| Uranium Concentrate Cost ($/t con): | $925.00 |
| CAD | $686.51 | 1.347 |
| CapEx Note: Usde CAD $2 billion in 2016, inflated by 25% to $2.5 billion in 2024. |
| Sustaining Capital Note: Used CAD $700 million in 2016, inflated by 25% to $875 milliom in 2024. |
| Mining Cost Note: Used CAD $3,623/t in 2016, inflated by 25% in 2024 to $4,500. |
| Processing Cost Note: Used CAD $3,157/t in 2016, inflated by 25% to $4,000 in 2024. |
| Other Cost Note: Used CAD $460 in 2016, inflated by 25% to $600 in 2024 |
| Metal 1 Con Cost Note: Used CAD $740/t in 2016, inflated by 25% to $925 in 2024. |
| Risk Factors - Risk-Adjusted Discount Rate: 8.0% |
| Risk Level | Risk Weight | Confidence | Note |
| Environmental Permitting: | Very Low | 0.5 | SS | Protocols for permitting underground mines in the Athabasca Basin well established. |
| Social License: | Low | 1.0 | SU | Multiple groups need to be dealt with, but familiar with existing mining regime. |
| Title: | Very Low | 0.5 | SS |
|
| Tax: | Very Low | 0.5 | SS | Already has 7.25% NSR to province as basic royalty, tiered profit royalty of 10%-15% and 15% federal and 12% provincial income tax. |
| GeoPolitical: | Very Low | 1.0 | VS | Saskatchewan ranked very high as mining friendly. |
| Infrastructure: | Very Low | 0.5 | SS | Not far from McArthur River. |
| Technical: | Low | 2.5 | SU | Ore at unconformity will have to deal with water flow problems as at Cigar Lake, though lots of experience gained so better understanding today. |
| Management: | Very Low | 0.5 | VS | Top people ex-Cameco. Diluting partner Cameco can provide input. |
| Financing: | Low | 1.0 | SS | Canalaska has substantial backing. |
| Risk Factor Weight Table |
| Very Low | Low | High | Very High |
|---|
| Environmental Permitting: | 0.5 | 1.0 | 1.5 | 2.0 |
| Social License: | 0.5 | 1.0 | 1.5 | 2.0 |
| Title: | 0.5 | 1.0 | 1.5 | 2.0 |
| Tax: | 0.5 | 1.0 | 1.5 | 2.0 |
| GeoPolitical: | 0.5 | 1.0 | 1.5 | 2.0 |
| Infrastructure: | 0.5 | 1.5 | 2.5 | 4.0 |
| Technical: | 1.0 | 2.5 | 4.0 | 5.5 |
| Management: | 0.5 | 1.5 | 3.0 | 4.0 |
| Financing: | 0.5 | 1.0 | 1.5 | 2.0 |
| The risk adjusted discount rate is the sum of the weight of the risk level assigned to each risk factor. |
| Disclaimer: A visualized outcome is one of many possible outcomes for an exploration project as it moves through the 9 stages of the exploration-development cycle from grassroots to a producing mine with failure as an outcome at any point along the way. The range of possible outcomes for the physical nature of a deposit shrinks after delivery of an initial 43-101 resource estimate. While the nature of the deposit constrains the range of mining scenarios, the cost assumptions will vary as the project moves through the feasibility demonstration stages of the cycle, which affects the economic value of the final outcome. This economic value will also vary according to the prices of the metals targeted for extraction which may change during the years it takes for a project to become a mine. An outcome visualization is thus a compilation of best guess assumptions for the key variables that drive the discounted cash flow model, the basis for assigning an economic value to a mine. An OV is not intended as a prediction, but rather as a framework that allows the incorporation of new information generated by the exploration-development cycle for the project into a valuation model on an ongoing, dynamic basis. |
.
|