Home / Works Archive / Trackers
Trackers
| | Wed Feb 23, 2022
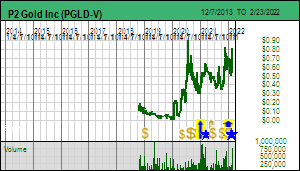
Tracker: P2 Gold - Updated Gabbs Outcome Visualization based on 2022 resource estimate
Publisher: Kaiser Research Online
Author: Copyright 2022 John A. Kaiser
|
| |
| Outcome Visualization Project as of Feb 23, 2022: P2 Gold Inc: Gabbs |
| Project: | Gabbs | Location: | United States | Stage: | 4-Infill Drilling |
| Net Interest: | 100% WI | Uncapped NSR: | 0.0% | Target Metals: | Gold Copper |
| OV Project ID: | 1000034 | OVP Posted: | 10/27/2021 | OVP Retired: |
|
| Current OV ID: | 1000091 | Current OV Confirmed: | 2/17/2022 | Visualizer: | JK |
Issued
62,374,395 |
Price
$0.750 |
Working Capital
($1,347,212) |
Key People: Joseph J. Ovsenek (CEO), Grant Bond (CFO), Kenneth C. McNaughton (VP EX), |
Diluted
90,446,097 |
Insiders
40.1% |
As of
9/30/2021 |
 |  |
| Visualized Outcome: P2 Gold Inc: Gabbs - 20,000 tpd OP HL/Flot Scenario |
| The Gabbs project is a cluster of copper-gold deposits in Nevada that P2 Gold has acquired from Waterton and which have received considerable work in the past from various operators on which a 43-101 resource estimate for 4 zones - Sullivan, Lucky Strike, Car Body and Gold Ledge - with oxides and sulphides has been defined. The objective is to update the resource estimate and potentially expand the tonnage by extending the depth of the Sullivan and Lucky Strike zones, complete metallurgical studies to support a two track flowsheet where the oxides are heap leached and the sulphides are milled and floated to produce a copper concentrate, and deliver a PEA by the end of 2022. Because the OV model only works with a single LOM flowsheet the costs and recoveries have been averaged out to reflect the relative proportion of sulphide and oxide ore. This OV replaces the Oct 27, 2021 OV based on the 2021 43-101 inferred resource of 26,200,000 tonnes oxide at 0.72 g/t gold and 0.25% copper and 46,900,000 tonnes sulphide at 0.54 g/t gold and 0.26% copper. It is based on the Feb 10, 2022 resource estimate of 30,000,000 tonnes oxide at 0.61 g/t gold and 0.26% copper, and 83,400,000 tonnes sulphide at 0.35 g/t gold and 0.26% copper. The 20,000 tpd combined mining rate supports a 16 year mine life. The valuation upside resides in achieving better grades and expanding the mine life through bigger tonnage. |
| Visualized Outcome Summary: P2 Gold Inc: Gabbs - 20,000 tpd OP HL/Flot Scenario |
| Deposit Scenario: 113,400,000 t @ 0.26% Copper, 0.42 g/t Gold |
| Mining Scenario: Open Pit 20,000 tpd 15.5 yrs, CapEx $375.0 million, SustCapEx $96.0 million, OpEx $23.51/t (USD), AISC $27.66/t (USD) |
| LOM Payable: 475.0 million lb copper, 1.3 million oz gold |
| Economic Value (after-tax): IRR 23.8%, Payback 4.0 yrs, NPV at 7.5% - USD $413,518,643, Future Price/sh: CAD $5.81 |
| Economic Outcome - Discount Rate: 7.5% - CAD AT NPV: $526.0 million - Poor Speculative Value |
| Gross Rock Value (USD/t): | $52 | Recoverable Rock Value: | $42 | Payable Rock Value: | $40 |
| LOM CapEx & Sustaining Cost: | $471,000,000 | LOM Operating Cost: | $2,666,034,000 | AISC per tonne: | $27.66 |
| LOM Net Payable Revenue (USD): | $4,503,509,522 | LOM PT Cash Flow (USD): | $1,741,475,522 | LOM AT Cash Flow (USD): | $1,399,856,642 |
| USD Pre-Tax NPV: | $589,895,942 | Pre-Tax IRR: | 29.4% | Pre-Tax Payback: | 3.3 |
| USD After-Tax NPV: | $413,518,643 | After-Tax IRR: | 23.8% | After-Tax Payback: | 4.0 |
| CAD Fair Spec Value Low: | $26,295,651 | CAD Fair Spec Value High: | $52,591,301 | CAD Implied Project Value: | $67,834,573 |
| Price Target if Visualized Outcome delivered by Expl-Dev Cycle without dilution: CAD $5.81 |
| Economic Outcome (USD): Revenue Model at OV designated Metal Prices |
| Annual Average | Life of Mine (LOM) | LOM Stats |
| Recoverable Revenue: | $309,623,328 | $4,809,765,122 | $42/t ore Recoverable Value: |
| Smelter/Transport Costs: | ($19,714,867) | ($306,255,600) | 6.4% of Recoverable Revenue |
| Gross Payable Revenue: | $289,908,461 | $4,503,509,522 | 93.6% of Recoverable Revenue |
| Royalties: | $0 | $0 | 0.0% of Gross Payable Revenue |
| Net Payable Revenue: | $289,908,461 | $4,503,509,522 | 93.6% of Recoverable Revenue |
| Mining Cost: | ($46,866,000) | ($728,028,000) | 26% of OpEx - $6.42/t ore |
| Processing Cost: | ($119,793,000) | ($1,860,894,000) | 67% of OpEx - $16.41/t ore |
| Other Cost: | ($4,964,000) | ($77,112,000) | 3% of OpEx - $0.68/t ore |
| Sustaining Cost: | ($6,000,000) | ($96,000,000) | 3% of OpEx - $0.85/t ore |
| Total Operating Cost: | ($177,623,000) | ($2,762,034,000) | 61% of Net Payable Revenue - OpEx - $24.36/t ore |
| Pre-Tax Cash Flow: | $112,285,461 | $1,741,475,522 | 39% of Net Payable Revenue - $15.36/t ore |
| Taxes: | ($21,821,365) | ($341,618,881) | 20% of Pre-Tax Cash Flow - $3.01/t ore
|
| After-Tax Cash Flow: | $90,464,096 | $1,399,856,642 | 31% of Net Payable Revenue - $12.34/t ore |
| Note: Concentrate transport costs, smelter treatment costs and retention are subtracted from recoverable revenue to get gross payable revenue to which the uncapped royalty rate for the project is applied. The annual average of LOM sustaining cost is expensed as an annual operating cost. Annual average figures reflect full production years. |
| Economic Outcome (USD): Royalty Model for 1% NSR at OV designated Metal Prices |
| Mine Life: | 16 years | Startup | NPV 5% | NPV 10% | NPV 15% |
| Annual Avg NSR: | $2,899,085 | Now | $29,334,326 | $20,352,489 | $14,884,814 |
| LOM NSR: | $45,035,095 | 2025 | $25,340,093 | $15,291,126 | $9,787,007 |
 |
| Fair Speculative Value Stock Price Range: CAD $0.29 - $0.58 |
| MSV (Market Cycle S Curve): Market Speculative Value represents the typical market pricing pattern of a new discovery as it moves through its exploration-development cycle. The irrational pricing behavior of the yellow channel contrasts with the fair speculative value of the blue channel as defined by the rational speculation model because during the pre-economic study stages there is great uncertainty about how big the discovery will turn out. |
Fair Speculative Value Ladder
| USD OV NPV | CAD OV NPV | Exch Rate | Diluted | Net Interest |
|---|
| $413,518,643 | $525,913,010 | 1.2718 | 90,446,097 | 100.00% |
|---|
| Project Stage | Uncertainty Range | CAD FSV Range | CAD FSV per Share Range | CAD MSV per Share Range |
|---|
| Grassroots |
0.5% - 1.0% |
$2,629,565 - $5,259,130 |
$0.03 - $0.06 |
$0.06 - $0.15 |
| Target Drilling |
1.0% - 2.5% |
$5,259,130 - $13,147,825 |
$0.06 - $0.15 |
$0.15 - $0.29 |
| Discovery Delineation |
2.5% - 5.0% |
$13,147,825 - $26,295,651 |
$0.15 - $0.29 |
$0.29 - $4.36 |
| Infill & Metallurgy |
5% - 10% |
$26,295,651 - $52,591,301 |
$0.29 - $0.58 |
$2.91 - $5.81 |
| PEA |
10% - 25% |
$52,591,301 - $131,478,253 |
$0.58 - $1.45 |
$1.45 - $4.36 |
| Prefeasibility |
25% - 50% |
$131,478,253 - $262,956,505 |
$1.45 - $2.91 |
$1.45 - $2.91 |
| Permitting & Feasibility |
50% - 75% |
$262,956,505 - $394,434,758 |
$2.91 - $4.36 |
$1.45 - $2.91 |
| Construction |
75% - 100% |
$394,434,758 - $525,913,010 |
$4.36 - $5.81 |
$2.91 - $4.36 |
| Production |
100% |
$525,913,010 |
$5.81 |
$5.81 - $7.27 |
 |
| Market Speculative Value Stock Price Range: CAD $2.91 - $5.81 |
| Warning: while the market spec value (S-Curve) and fair spec value channels presented in project value terms track the evolving expected ultimate outcome value, when presented in stock price terms the expected stock prices are subject to dilution through future equity financings or project interest farmouts. |
| Alternative Metal Price Scenarios |
| Metal 1 | Metal 2 | Metal 3 | Metal 4 |
| Copper | Gold |
|
|
| Spot: | $4.54 /lb | $1,905 /oz |
|
| | OV Assigned: | $4.54 /lb | $1,905 /oz |
|
| | Pessimistic: | $2.50 /lb | $1,905 /oz |
|
| | Optimistic: | $5.00 /lb | $1,905 /oz |
|
| | Fantasy: | $7.00 /lb | $1,905 /oz |
|
| | Note: for Metal 1 pessimistic, optimistic and fantasy price scenarios, OV assigned prices are used for Metals 2-4 |
| Economic Outcomes with Alternative Metal Price Scenarios |
| USD PT NPV | USD PT IRR | USD AT NPV | USD AT IRR | AT Payback yrs |
| Spot: | $589,895,942 | 29.4% | $413,518,643 | 23.8% | 4.0 |
| OV Assigned: | $589,895,942 | 29.4% | $413,518,643 | 23.8% | 4.0 |
| Pessimistic: | $67,419,069 | 10.4% | $21,660,989 | 8.5% | 8.3 |
| Optimistic: | $707,709,354 | 33.3% | $501,878,703 | 26.9% | 3.6 |
| Fantasy: | $1,219,941,582 | 49.9% | $886,052,873 | 39.8% | 2.5 |
| Fair Speculative Value for Alternative Metal Price Scenarios |
| Stage: Infill & Metallurgy - 5.0% - 10.0% |
| CAD AT NPV | CAD Target Price | CAD FSV Range | CAD FSV per Share Range | CAD MSV per Share Range |
| Spot: | $525,913,010 | $5.81 | $26,295,651 - $52,591,301 | $0.29 - $0.58 | $2.91 - $5.81 |
| OV Assigned: | $525,913,010 | $5.81 | $26,295,651 - $52,591,301 | $0.29 - $0.58 | $2.91 - $5.81 |
| Pessimistic: | $27,548,446 | $0.30 | $1,377,422 - $2,754,845 | $0.02 - $0.03 | $0.15 - $0.30 |
| Optimistic: | $638,289,334 | $7.06 | $31,914,467 - $63,828,933 | $0.35 - $0.71 | $3.53 - $7.06 |
| Fantasy: | $1,126,882,045 | $12.46 | $56,344,102 - $112,688,204 | $0.62 - $1.25 | $6.23 - $12.46 |
| Detailed Visualized Outcome (KRO Members Only) |
| VU = Very Unsure |
SU = Somewhat Unsure |
SS = Somewhat Sure |
VS = Very Sure |
| The confidence indicator is intended to convey the visualizer's degree of uncertainty with regard to a particular assumption. |
| Deposit Scenario |
| Metal 1 | Metal 2 | Metal 3 | Metal 4 |
| Copper
Cu | Gold
Au |
|
|
| Grade: | 0.26% | SS | 0.42 g/t | VS | |
| |
|
| Recovery: | 77.0% | SS | 87.0% | SS |
|
|
|
|
| Payable: | 95.0% | SS | 98.0% | SS |
|
|
|
|
| Concentrate Grade: | 28.0% | VU | 0.0% | VS |
|
| Price: | $4.54 /lb | VS | $1,904.70 /oz | VS | |
| |
|
| Price Type: | Spot |
| Spot |
|
|
|
|
|
| Annual Payable: | 30,608,380 lb |
| 84,045 oz |
|
|
|
|
|
| LOM Payable: | 475,478,119 lb |
| 1,305,576 oz |
|
|
|
|
|
| Metal 1 Note: The grade and recovery are averages of total oxide and sulphide ore for the combined indicated and inferred resources. Oxide is 0.26% Cu with 48% recovery, sulphide is 0.26% Cu and 87% recovery. |
| Metal 2 Note: The grade and recovery are averages of total oxide and sulphide ore for the combined indicated and inferred resources. Oxide is 0.61 g/t Au with 76% recovery, sulphide is 0.35 g/t Au and 94% recovery. |
| Mining Scenario |
| Tonnage: | 113,400,000 | VS | Strip Rate: | 2.0 | SU |
| Operating Rate (tpd): | 20,000 | SS | Mining Type: | Open Pit | VS |
| Mine Life (years): | 15.5 |
| Startup: | 2025 | VU |
| Tax Treatment: | DDBM - double declining balance | SU | Tax Rate: | 25.0% | VS |
| Tonnage Note: The resource is the inferred 43-101 estimate produced Feb 10, 2022 by P&E which combines the 4 zones - Sullivan, Lucky Strike, Car Body and Gold Ledge first into oxide and sulphide components, and then into a single resource with average copper and gold grades. The mining assumption is that heap leaching of the oxides and milling-flotation of the sulphides will be conducted at a relative scale that depletes the oxides within 10 years. The current ratio of oxide and sulphide is 26% and 74%. Oxide I+I is 30,000,000 t @ 0.72 g/t Au and 0.25% Cu, sulphide I+I is 83,400,000 t @ 0.35 g/t Au and 0.26% Cu. |
| Strip Rate Note: Based on management estimates. |
| Operating Rate Note: 20,000 tpd combines ore headed for the heap leach pile and the mill-flotation circuit, the oxides representing 26% of annual mined ore and the sulphides 74%. |
| Mining Type Note: The existing resource is within open-pittable depth. |
| Tax Treatment Note: This approach increases the cash flow in the earlier years when payback is important. |
| Tax Rate Note: The federal corporate tax rate is 21%. Nevada has no state corporate tax but does have a 5% minerals tax on net profits. Since a minerals tax is deductible before application of the federal tax rate, the effective tax rate is 24.95%: ((1-0.05) x 0.21) + .05 |
| Cost Scenario |
| Currency | USD Cost | Exchange Rate |
| CapEx: | $375,000,000 | VU | USD | $375,000,000 | 1.000 |
| Sustaining Capital: | $96,000,000 | VU | USD | $96,000,000 | 1.000 |
| Mining Cost ($/t rock): | $2.14 | SS | USD | $2.14 | 1.000 |
| Mining Cost ($/t ore): | $6.42 |
| USD | $6.42 | 1.000 |
| Processing Cost ($/t): | $16.41 | SS | USD | $16.41 | 1.000 |
| Other Cost ($/t): | $0.68 | SS | USD | $0.68 | 1.000 |
| Total OpEx ($/t): | $23.51 |
| USD | $23.51 | 1.000 |
| Copper Concentrate Cost ($/t con): | $175.00 |
| USD | $175.00 | 1.000 |
| CapEx Note: This number I am least confident about. The $6 million needed to buy out the Waterton NSR is included in CapEx. |
| Sustaining Capital Note: Based on $7.5 million for each of the 16 year mine life. |
| Mining Cost Note: Mining cost is assumed to be the same for oxide and sulphide, though by using a LOM average strip of 2:1 the total mining cost punishes the cash flow in the earlier year when a lower strip rate applies. The cost figures used where those the resource estimate used to develop cut-off grades. |
| Processing Cost Note: The processing cost is a blend of heap leaching and milling/flotation costs. Heap leaching is estimated at $14/t ore and milling at $17.34/t ore. The $16.41/t average prcoessing cost is calculated by adding the seperate processing costs for oxide and sulphide ore and dividing by the combined resource tonnage. This assumes the same relative processing rate in each year of the LOM, but the reality is that the oxides will be depleted earlier, so this approach makes the cash flow in the early years lower than would be in reality. |
| Metal 1 Con Cost Note: The concentrate grade is expected to be 25%-30%. This figure is muddled by the fact that the copper recoverd from heap leaching does not end up in the concentrate. However, the oxide copper represents only 12% of LOM copper output, so 28% was chosen lower the impact of transport cost to the smelter. |
| Risk Factors - Risk-Adjusted Discount Rate: 7.5% |
| Risk Level | Risk Weight | Confidence | Note |
| Environmental Permitting: | Very Low | 0.5 | SS | Nevada may be the best jurisdiction in the US to permit a mine. Gabbs is within the BLM rather than USFS jurisdiction. |
| Social License: | Very Low | 0.5 | VS | There are no indigenous people in the area and there are already operating open pit mines in the area. |
| Title: | Low | 1.0 | SS | The risk that Waterton does not have underlying title to Gabbs is very low, but P2 Gold's title hinges on making a USD $4 million payment to Waterton which is not currently funded. However, Waterton with 15 million shares representing 25% of issued is the largest shareholder, and if there is a reason P2 Gold does not have the cash when it is due, will likely agree to a modification of the terms to prevent default. |
| Tax: | Low | 1.0 | SS | There is an ongoing push by progressive Democrats and NIMBY advocates to destroy America's mining industry by creating super-royalties such as exist in third world countries. However, the bigger threat is that the 21% federal rate will rise. |
| GeoPolitical: | Very Low | 1.0 | VU | It is best to ignore hand-wringing about the cultural war between autocrats and liberals leading to a breakup of America. This probably would not happen as a coup as attempted on January 6, 2021, but would occur as a gradual slide into autocracy. |
| Infrastructure: | Very Low | 0.5 | VS | Power, roads and people are close by. |
| Technical: | Very Low | 1.0 | SS | Enough work has been done on the mineralogy that fatal surprises are unlikely, and the P2 Gold management team has plenty of experience with advanced projects. |
| Management: | Very Low | 0.5 | VS | Very experienced management team. |
| Financing: | High | 1.5 | SS | Although Joe Ovsenek and Ken MacNaughton were key people at Pretium, that did not help with the institutional audience in 2021 when they acquired Gabbs as a feasibility demonstration project. To deliver the PEA and vest they will need to raise $10 million plus over the next 12 months. The risk is at what dilution price does this happen? |
| Risk Factor Weight Table |
| Very Low | Low | High | Very High |
|---|
| Environmental Permitting: | 0.5 | 1.0 | 1.5 | 2.0 |
| Social License: | 0.5 | 1.0 | 1.5 | 2.0 |
| Title: | 0.5 | 1.0 | 1.5 | 2.0 |
| Tax: | 0.5 | 1.0 | 1.5 | 2.0 |
| GeoPolitical: | 0.5 | 1.0 | 1.5 | 2.0 |
| Infrastructure: | 0.5 | 1.5 | 2.5 | 4.0 |
| Technical: | 1.0 | 2.5 | 4.0 | 5.5 |
| Management: | 0.5 | 1.5 | 3.0 | 4.0 |
| Financing: | 0.5 | 1.0 | 1.5 | 2.0 |
| The risk adjusted discount rate is the sum of the weight of the risk level assigned to each risk factor. |
| Disclaimer: A visualized outcome is one of many possible outcomes for an exploration project as it moves through the 9 stages of the exploration-development cycle from grassroots to a producing mine with failure as an outcome at any point along the way. The range of possible outcomes for the physical nature of a deposit shrinks after delivery of an initial 43-101 resource estimate. While the nature of the deposit constrains the range of mining scenarios, the cost assumptions will vary as the project moves through the feasibility demonstration stages of the cycle, which affects the economic value of the final outcome. This economic value will also vary according to the prices of the metals targeted for extraction which may change during the years it takes for a project to become a mine. An outcome visualization is thus a compilation of best guess assumptions for the key variables that drive the discounted cash flow model, the basis for assigning an economic value to a mine. An OV is not intended as a prediction, but rather as a framework that allows the incorporation of new information generated by the exploration-development cycle for the project into a valuation model on an ongoing, dynamic basis. |
|
| |
| | You can return to the Top of this page
|
|