Home / Companies / KRO Profile
KRO Profile
|
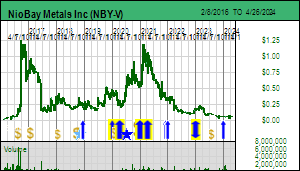
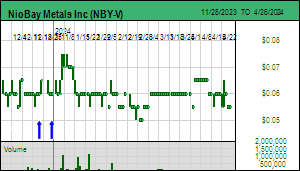
NioBay Metals Inc (NBY-V)
| Trade Date | Volume | High | Low | Close | Chg | Status |
| April 15, 2024 | 5,100 | $0.060 | $0.060 | $0.060 | $0.000 | Trading |
| Basic Info |
|---|
| Listed On: | TSX Venture: NBY | 1/6/1997 | Sector: | Resource | Key People |
| Issued: | 79,068,523 | 9/30/2023 | Story Type: | Feasibility Demonstration | Jean-Sebastian David (CEO), Serge Savard (Chair), Anthony Glavac (CFO), |
| Diluted: | 92,039,477 |
| JK Owns: | Yes |
| Insider Stake: | 19% | 6/8/2023 | Tel: | (514) 866-6500 |
| Working Capital: | $3,577,751 | 9/30/2023 | Email: |
| Address |
| Market Cap: | $4,744,111 |
| Web Site: | niobaymetals.com | 1111 St. Charles West, Suite 101, Longueuil, QC, J4K 5G4, Canada |
| Cash Breakup: | $0.04 | per sh | Twitter: | @NioBayMetals |
| Spec Value Rating History |
| Dec 14, 2018 |
$0.270 |
Bottom-Fish Spec Value |
 |
New |
| Apr 9, 2020 |
$0.300 |
Good Spec Value |
 |
New |
| Dec 31, 2020 |
$0.540 |
Good Spec Value |
|
New |
| Dec 2, 2021 |
$0.350 |
Bottom-Fish Spec Value |
|
New |
| Dec 31, 2021 |
$0.320 |
Bottom-Fish Spec Value |
|
New |
| Nov 28, 2022 |
$0.105 |
Bottom-Fish Spec Value |
|
New |
| Dec 30, 2022 |
$0.180 |
Fair Spec Value |
 |
New |
| Dec 21, 2023 |
$0.060 |
Bottom-Fish Spec Value |
|
New |
| Dec 29, 2023 |
$0.060 |
Bottom-Fish Spec Value |
|
New |
| Spec Value Rating Overview Updated January 6, 2023 |
| SV Rating: Bottom-Fish Spec Value - as of December 29, 2023: NioBay Metals Inc was made a Fair Spec Value rated 2023 Favorite at $0.18 on December 30, 2022 based on early evidence a major new niobium bearing carbonatite has been discovered under a lake a few km to the west of the existing low grade Crevier syenite dyke hosted niobium-tantalum deposit located in southern Quebec about 150 km northwest of the Niobec Mine now owned by a private group called Magris which owns 27.5% of Crevier. The stock was rated a Good Spec Value Favorite in 2020 and 2021 based on the PEA completed in late 2020 for the James Bay carbonatite hosted niobium deposit in northern Ontario near the town of Moosonee. This deposit was discovered in the 1960s but never developed because of its remote location and the superior Niobec deposit in southern Quebec. NioBay acquired the James Bay project in early 2016 but could not start work because the chief of the Moose Cree First Nation, who represented an anti-mining stance with an emphasis on traditional Indigenous activities such as hunting, fishing and trapping, refused to engage in consultations with NioBay as required by Ontario's drill permitting process. She was ousted in mid 2019 tribal council elections and replaced by a new chief who engaged with NioBay in a manner that would protect community interests. This allowed NioBay to conduct a drill program in 2020 to support an updated resource and delivery of a PEA in October 2020 for a 6,600 tpd open pit mining scenario. Open pit mining was chosen over underground mining because the Moosonee community members preferred jobs operating equipment above ground rather than underground. At the base case price of $45/kg ferro-niobium James Bay has an after-tax NPV ranging from USD $638 million at 10% to $1.25 billion at 5% discount rates with an IRR of 30.4%. With CapEx at USD $393 million James Bay clears development hurdles. Based on 82 million shares fully diluted this represents a future price target in the $11-$22 range. NioBay started PFS related drilling in 2022 but was forced to stop when the anti-mining faction pulled the chief into a survey trap that split the community but resulted in a thumbs down to exploration activity in their backyard. The stock price collapsed and NioBay was given a Bottom-Fish Spec Value rating based on the hope that the MCFN would eventually support feasibility demonstration work to bring the project to a level where environmental concerns are addressed and the basis for a benefits agreement is in place. The focus changed in late December 2022 when NioBay reported visual results for a 10 hole drill program on the 72.5% owned Crevier project on which it had spent $9 million between 2009-2012 delivering a PEA and giving up when the bench scale flow-sheet did not scale up. In any case the 41 million tonne deposit grading 0.19% Nb2O5 project was marginal and because CBMM through its giant Araxa Mine in Brazil can control supply to meet global demand, there is no optionality bet on higher niobium prices. With James Bay sidelined CEO Jean-Sebastian David decided to revisit the 10 km by 4 km alkaline intrusive complex to see if there was potential for a richer zone than the late stage dyke. The area had been clear cut logged in recent years which allowed field crew to observe softer carbonate rocks in the creek beds. Hole #5 across the creek with the carbonate outcrop encouraged the crew to drill a hole across Lac Touladi which delivered a long carbonatite interval containing the key niobium mineral pyrochlore. A total of 4 holes were drilled under the lake along a 1,500 km strike, all with similar visuals. An XRF unit has confirmed substantially better niobium content than the syenite dyke core, but until NioBay receives assays the average grade and zonation remains unknown. The tonnage footprint is comparable to Niobec which in 2011 had underground mineable M+I+I resources of 794 million tonnes of 0.37%-0.43% Nb2O5 remaining with a 0.2% cutoff. After the stock nearly doubled from its bottom-fish level in the wake of this news NioBay was upgraded to Fair Spec Value and made a 2023 Favorite at $0.18 with very significant upside if assays confirm grades in excess of 0.4% Nb2O5 over substantial widths. Because the project is an the jurisdiction of First Nations groups engaged in all manner of commercial activites and has only one seasonal fishing cottage on the lake, NioBay will be able to fast-track delineation if assyas confirm a major new niobium discovery. |
| What's Next? |
| Updated April 9, 2021: NioBay Metals Inc was made a Bottom-Fish Spec Value rated 2020 Favorite at $0.45 on December 31, 2019, upgraded to Good Spec Value at $0.30 on April 9, 2020, and continued as a Good Spec Value rated 2021 Favorite at $0.54 on December 31, 2020. SVR Overview Tracker April 9, 2021 confirms the Good Spec Value rating at $0.85 with a Fair Spec Value near term target in the $3-$6 range based on the PEA defined fundamentals of the James Bay niobium project. Tracker Feb 15, 2021 provides a detailed explanation of the James Bay project, the future of niobium, and a niobium price sensitivity analysis using a DCF model based on the PEA's technical report. The company started 2021 with $14 million raised in December 2020 at $0.65 for hard dollar units and $0.68 for flow-thru shares. This private placement came free trading on April 9, 2021 and the result has been a rush to sell by clip and flippers among the 100 placees rounded by Canaccord and Sprott Capital. NioBay is sufficiently funded to deliver a PFS which was initially expected in mid 2022, but is not expected until the end of 2022. NioBay was supposed to mount a 12,000 m drill program in Q1 of 2021 to infill drill the James Bay deposit so that the resource can be completely upgraded to indicated category as required by a PFS. The drilling would also delineate a high grade core identified during the 2020 winter drill program which may allow NioBay to consider expanding the 6,600 tpd mill to as high as 10,000 tpd. The core would also furnish additional sample material for metallurgical studies, including studies to see what is involved in making niobium oxide, the battery grade form required by lithium ion batteries which replace graphite in the anode with a niobium-titanium material that allows faster charging time without safety compromise. The warm winter resulted in a slow start to building the track alongside the resident-only winter road that connects Moosonee with Cochrane. The contractor was observed using the winter road to speed up building the haul track for the drill rig which upset the Moosonee community and drew a rebuke from the MCFN chief. NioBay pulled the plug on the winter drilling program which was in danger of losing its crew because the drill rig had not arrived on time. The Moosonee community now understands that this was not a flagrant violation by NioBay of the "protection agreement" that had been signed weeks ahead of the violation. But in person meetings are required to reinstate the agreement in support of a summer drilling program which will also initiate environmental baseline studies that would create a fair number of local jobs. But first Ontario must lift its 4 week emergency lockdown imposed when covid related ICU hospitalizations hit a record in March. And then the Moosonee community must feel comfortable enough to allow outside visitors such as NioBay management to sit down with the elders who, although they have been vaccinated, understandably feel vulnerable to the new P.1 variant circulating in Canada which in Brazil has reinfected people who had covid last year. For the moment there is uncertainty that the PFS drilling will get underway this summer, especially because drill contractors are booked up. Confirmation that drilling will happen this summer is the key milestone we need to see the market chase the stock into the $3-$6 range where it deserves to trade while we await completion of the PFS now expected at the end of 2022. We are also waiting to hear what, if anything, NioBay may get underway at its Crevier niobium-tantalum project in Quebec where PFS work stalled in 2012 when large scale metallurgical studies failed to duplicate bench scale recoveries on which a PEA had relied. We are also waiting for confirmation that the niobium based battery on which Toshiba is working and for which CBMM has publicly expressed great hopes for substantial niobium growth beyond steel alloying demand is heading toward commercialization. That will expand niobium from being a "lightweighting" clean energy metal to also being a battery metal. |
| Corporate Change History |
|
| #Old for New | Last Price | Prior Name | Subsequent Name | Details |
|---|
| Mar 31, 2016 | New Exchange Listing | 1:1 | $0.05 | MDN Inc (MDN-T) | MDN Inc (MDN-V) |
|
| Sep 21, 2016 | Name Change | 5:1 | $0.22 | MDN Inc (MDN-V) | Niobay Metals Inc (NBY-V) |
|
| Recommendation History |
|---|
| Edition |
Date |
Price |
|
Recommendation |
Gain |
| BF2009 |
12/24/2008 |
$0.56 |
 |
New BF TP Buy $0.50-$0.75 |
-25% |
| BF2009 |
12/30/2011 |
$0.22 |
 |
BF Technical Closeout Hold 0% |
-71% |
| SVF2020 |
12/31/2019 |
$0.45 |
 |
Bottom-Fish Spec Value Favorite |
0% |
| SVF2020 |
4/9/2020 |
$0.30 |
 |
Good Spec Value Favorite |
-33% |
| SVF2020 |
12/31/2020 |
$0.54 |
|
Good Spec Value Favorite |
20% |
| SVF2021 |
12/31/2020 |
$0.54 |
|
Good Spec Value Favorite |
0% |
| SVF2021 |
4/9/2021 |
$0.86 |
|
Good Spec Value Favorite Confirmed |
59% |
| SVF2021 |
12/31/2021 |
$0.33 |
|
SV Technical Closeout 100% |
-40% |
| SVF2023 |
12/30/2022 |
$0.18 |
 |
Fair Spec Value Favorite |
0% |
| SVF2023 |
12/29/2023 |
$0.06 |
|
SV Technical Closeout 100% |
-67% |
 |
 |
 |
 Most recent 43-101 resource estimate Most recent 43-101 resource estimate  Prior resource estimate Prior resource estimate  PEA PEA  PFS PFS  FS/BFS/DFS FS/BFS/DFS |
|---|
| Private Placement Key |
|---|
 |
less than $500,000 |
 |
$1,000,000 - $2,000,000 |
 |
$5,000,000 - $10,000,000 |
 |
$20,000,000 - $50,000,000 |
 |
$500,000 - $1,000,000 |
 |
$2,000,000 - $5,000,000 |
 |
$10,000,000 - $20,000,000 |
 |
over $50,000,000 |
| Private placement financing dates and value ranges are based on transactions reported by the TSXV Monthly Review. |
| Date |
Company |
Type |
Quantity |
Price |
FT |
Units |
Amount |
Broker |
| Aug 9, 2016 |
MDN Inc |
PP |
35,900,000 |
$0.050 |
|
|
$1,795,000 |
|
| Jan 16, 2017 |
Niobay Metals Inc |
PP |
1,377,626 |
$0.850 |
FT |
|
$1,170,982 |
|
| Jan 19, 2018 |
Niobay Metals Inc |
PP |
814,075 |
$0.270 |
FT |
|
$219,800 |
|
| Jan 19, 2018 |
Niobay Metals Inc |
PP |
2,890,909 |
$0.220 |
|
|
$636,000 |
|
| Oct 12, 2018 |
Niobay Metals Inc |
PP |
9,000,000 |
$0.260 |
|
|
$2,340,000 |
|
| Dec 31, 2019 |
Niobay Metals Inc |
PP |
4,525,698 |
$0.385 |
FT |
Units |
$1,742,394 |
|
| Dec 31, 2019 |
Niobay Metals Inc |
PP |
1,710,200 |
$0.350 |
|
Units |
$598,570 |
|
| Jan 24, 2020 |
Niobay Metals Inc |
PP |
328,571 |
$0.350 |
|
Units |
$115,000 |
|
| Dec 22, 2020 |
Niobay Metals Inc |
PP |
10,094,910 |
$0.650 |
FT |
Units |
$6,561,692 |
|
| Dec 22, 2020 |
Niobay Metals Inc |
PP |
7,399,127 |
$0.680 |
FT |
|
$5,031,406 |
|
| Jul 27, 2023 |
Niobay Metals Inc |
PP |
3,514,999 |
$0.120 |
FT |
Units |
$421,800 |
|
| Jul 27, 2023 |
Niobay Metals Inc |
PP |
2,452,000 |
$0.110 |
FT |
Units |
$269,720 |
|
| Jul 27, 2023 |
Niobay Metals Inc |
PP |
1,800,000 |
$0.100 |
|
Units |
$180,000 |
|
| Financials Dated: September 30, 2023 |
Reporting Period: 9 months |
Year End: 12/31 |
Currency: CAD |
| Assets |
Liabilities |
Income |
| Cash Equivalents: |
$3,514,392 |
Current Liabilities: |
$447,785 |
Operating Revenues: |
$0 |
| Receivables etc: |
$511,144 |
Tangible LT Debt: |
$0 |
Operating Cash Costs: |
$0 |
| Current Assets: |
$4,025,536 |
Intangible LT Debt: |
$0 |
Operating Cash Flow: |
$0 |
| Long Term Assets: | $517,244 | Total Liabilities: | $447,785 | Operating Non-Cash Costs: | $0 |
|
|
|
| Miscellaneous Revenue: | $0 |
| Total Assets: |
$4,542,780 |
Share Capital: |
$85,608,898 |
Cash Expenses: |
$2,146,631 |
|
|
Shareholder Deficit: |
($81,513,903) |
Non-Cash Expenses: |
$162,108 |
| Working Capital: |
$3,577,751 |
Net Shareholder Equity: |
$4,094,995 |
Total Expenses: |
$2,308,739 |
|
|
|
| Overall Cash Flow: | ($2,146,631) |
| Monthly Overhead: | $238,515 |
|
| Net Income (Loss): | ($2,308,739) |
|
| Note: |
Capital History
| Date Period | Cash Eq | Current
Assets | Total
Assets | Current
Liabilities | Total
Liabiltiies | Share
Capital | GAIN | Cash
Expenses | Diluted | Working
Capital |
|---|
| 9/30/2010 |
9 |
$7,680,337 |
$13,788,057 |
$48,337,433 |
$926,971 |
$3,950,487 |
$62,823,630 |
|
$3,178,499 |
0 |
$12,861,086 |
| 6/30/2011 |
6 |
$1,620,963 |
$10,348,215 |
$47,326,042 |
$2,015,679 |
$3,499,610 |
$63,448,630 |
|
$288,785 |
0 |
$8,332,536 |
| 9/30/2011 |
9 |
$1,466,122 |
$11,474,313 |
$49,714,665 |
$1,397,321 |
$1,477,231 |
$63,448,630 |
|
$3,578,537 |
102,595,887 |
$10,076,992 |
| 12/31/2011 |
12 |
$1,659,611 |
$10,977,297 |
$49,087,267 |
$503,100 |
$1,774,543 |
$63,813,193 |
|
$3,531,496 |
104,447,220 |
$10,474,197 |
| 3/31/2012 |
3 |
$4,089,633 |
$9,496,642 |
$47,307,320 |
$621,645 |
$1,267,234 |
$63,813,193 |
|
$962,316 |
104,447,220 |
$8,874,997 |
| 6/30/2012 |
6 |
$2,709,557 |
$8,164,165 |
$46,783,195 |
$423,094 |
$1,677,345 |
$63,813,193 |
|
$1,588,552 |
104,357,220 |
$7,741,071 |
| 9/30/2012 |
9 |
$4,625,511 |
$6,769,876 |
$45,516,684 |
$743,911 |
$1,912,536 |
$63,813,193 |
|
$2,582,343 |
104,327,220 |
$6,025,965 |
| 12/31/2012 |
12 |
$4,433,437 |
$5,724,911 |
$36,167,533 |
$828,946 |
$2,002,790 |
$63,813,193 |
0% |
$2,643,844 |
104,327,220 |
$4,895,965 |
| 3/31/2013 |
3 |
$3,429,986 |
$4,815,243 |
$35,777,911 |
$736,267 |
$1,890,054 |
$63,813,193 |
|
$539,702 |
104,227,220 |
$4,078,976 |
| 6/30/2013 |
6 |
$2,684,149 |
$4,035,988 |
$35,761,310 |
$736,588 |
$1,133,756 |
$63,813,193 |
|
$963,168 |
104,227,220 |
$3,299,400 |
| 9/30/2013 |
9 |
$2,539,865 |
$3,446,821 |
$35,213,835 |
$771,894 |
$1,112,252 |
$63,813,193 |
|
$1,269,713 |
104,087,220 |
$2,674,927 |
| 12/31/2013 |
12 |
$1,974,943 |
$2,865,864 |
$30,345,795 |
$753,527 |
$1,215,751 |
$63,813,193 |
0% |
$1,656,014 |
104,087,220 |
$2,112,337 |
| 3/31/2014 |
3 |
$1,533,763 |
$2,430,958 |
$30,691,430 |
$811,085 |
$1,273,442 |
$63,813,193 |
|
$235,794 |
104,087,220 |
$1,619,873 |
| 6/30/2014 |
6 |
$1,002,162 |
$1,867,136 |
$29,801,777 |
$752,659 |
$1,215,042 |
$63,813,193 |
|
$578,997 |
105,787,220 |
$1,114,477 |
| 9/30/2014 |
9 |
$1,265,918 |
$2,179,478 |
$31,096,280 |
$913,530 |
$1,375,754 |
$64,481,913 |
|
$880,944 |
118,217,539 |
$1,265,948 |
| 12/31/2014 |
12 |
$964,796 |
$1,815,460 |
$25,599,783 |
$864,833 |
$1,327,057 |
$64,481,913 |
1% |
$1,180,797 |
121,449,286 |
$950,627 |
| 3/31/2015 |
3 |
$1,069,138 |
$1,408,330 |
$26,437,557 |
$921,442 |
$462,224 |
$64,530,913 |
|
$259,931 |
117,867,539 |
$486,888 |
| 6/30/2015 |
6 |
$683,610 |
$1,066,722 |
$24,106,221 |
$877,897 |
$1,340,121 |
$64,530,913 |
|
$369,633 |
119,017,539 |
$188,825 |
| 9/30/2015 |
9 |
$451,280 |
$828,921 |
$24,056,014 |
$219,311 |
$681,535 |
$64,530,913 |
|
$454,042 |
119,312,539 |
$609,610 |
| 12/31/2015 |
12 |
$319,343 |
$551,142 |
$8,346,930 |
$236,894 |
$432,082 |
$64,530,913 |
0% |
$681,779 |
118,287,539 |
$314,248 |
| 3/31/2016 |
3 |
$442,447 |
$669,856 |
$8,216,222 |
$499,773 |
$694,961 |
$64,530,913 |
|
$130,639 |
118,437,539 |
$170,083 |
| 6/30/2016 |
6 |
$235,226 |
$445,559 |
$984,309 |
$463,261 |
$463,261 |
$64,880,913 |
|
$320,221 |
125,217,538 |
($17,702) |
| 9/30/2016 |
9 |
$1,464,600 |
$1,674,052 |
$1,674,052 |
$379,958 |
$379,958 |
$66,686,758 |
|
$523,091 |
32,260,301 |
$1,294,094 |
| 12/31/2016 |
12 |
$2,281,637 |
$2,489,187 |
$3,128,819 |
$620,601 |
$620,601 |
$67,805,705 |
5% |
($1,509,175) |
34,016,629 |
$1,868,586 |
| 3/31/2017 |
3 |
$1,876,689 |
$2,133,909 |
$2,907,933 |
$519,761 |
$519,761 |
$67,857,585 |
|
$156,716 |
34,183,221 |
$1,614,148 |
| 6/30/2017 |
6 |
$1,528,475 |
$1,778,791 |
$2,679,540 |
$426,427 |
$426,427 |
$67,857,585 |
|
$146,402 |
34,183,221 |
$1,352,364 |
| 9/30/2017 |
9 |
$1,346,657 |
$1,564,933 |
$2,699,696 |
$512,004 |
$512,004 |
$74,696,459 |
|
$409,320 |
32,985,127 |
$1,052,929 |
| 12/31/2017 |
12 |
$1,233,957 |
$1,474,141 |
$3,412,141 |
$438,307 |
$438,307 |
$68,702,682 |
1% |
$558,031 |
37,948,205 |
$1,035,834 |
| 3/31/2018 |
3 |
$3,224,756 |
$3,412,889 |
$5,427,430 |
$275,045 |
$275,045 |
$71,042,682 |
|
$159,779 |
46,908,205 |
$3,137,844 |
| 6/30/2018 |
6 |
$2,979,869 |
$3,159,430 |
$5,228,978 |
$232,390 |
$232,390 |
$71,042,682 |
|
$441,397 |
48,708,205 |
$2,927,040 |
| 9/30/2018 |
9 |
$2,664,849 |
$2,854,798 |
$5,103,837 |
$272,063 |
$272,063 |
$71,042,682 |
|
$650,630 |
48,708,205 |
$2,582,735 |
| 12/31/2018 |
12 |
$2,291,378 |
$2,526,271 |
$3,046,412 |
$331,343 |
$331,343 |
$71,042,682 |
3% |
$1,140,486 |
48,788,911 |
$2,194,928 |
| 3/31/2019 |
3 |
$1,985,215 |
$2,184,748 |
$2,702,612 |
$305,594 |
$305,594 |
$71,042,682 |
|
$325,520 |
48,938,911 |
$1,879,154 |
| 6/30/2019 |
6 |
$1,653,600 |
$1,863,962 |
$2,378,304 |
$270,542 |
$270,542 |
$71,042,682 |
|
$620,893 |
48,978,911 |
$1,593,420 |
| 9/30/2019 |
9 |
$1,399,618 |
$1,603,593 |
$2,114,404 |
$287,874 |
$287,874 |
$71,042,682 |
|
$905,286 |
48,978,911 |
$1,315,719 |
| 12/31/2019 |
12 |
$3,265,559 |
$3,573,828 |
$4,081,108 |
$683,818 |
$683,818 |
$73,241,204 |
3% |
$1,429,394 |
58,651,609 |
$2,890,010 |
| 3/31/2020 |
3 |
$2,042,401 |
$2,549,053 |
$3,063,706 |
$834,334 |
$834,334 |
$73,356,204 |
|
$1,431,387 |
59,236,465 |
$1,714,719 |
| 6/30/2020 |
6 |
$1,477,586 |
$1,743,226 |
$2,254,322 |
$465,870 |
$465,870 |
$73,388,739 |
|
$1,912,047 |
60,461,465 |
$1,277,356 |
| 9/30/2020 |
9 |
$1,065,673 |
$1,338,622 |
$1,846,162 |
$514,993 |
$514,993 |
$73,491,153 |
|
$2,661,023 |
60,460,665 |
$823,629 |
| 12/31/2020 |
12 |
$13,174,309 |
$13,492,533 |
$14,353,658 |
$1,058,806 |
$1,058,806 |
$84,345,026 |
15% |
$719,029 |
83,047,957 |
$12,433,727 |
| 3/31/2021 |
3 |
$11,957,145 |
$12,448,275 |
$13,225,447 |
$1,111,404 |
$1,111,404 |
$84,436,498 |
|
$1,265,318 |
83,039,957 |
$11,336,871 |
| 6/30/2021 |
6 |
$11,711,285 |
$12,266,042 |
$12,477,996 |
$622,883 |
$622,883 |
$84,569,289 |
|
$1,790,193 |
82,977,548 |
$11,643,159 |
| 9/30/2021 |
9 |
$11,487,233 |
$11,901,975 |
$12,085,183 |
$997,075 |
$997,075 |
$84,783,789 |
|
$2,810,993 |
84,357,748 |
$10,904,900 |
| 12/31/2021 |
12 |
$10,181,558 |
$10,814,492 |
$11,133,256 |
$1,106,064 |
$1,106,064 |
$84,783,789 |
1% |
$4,054,143 |
81,726,264 |
$9,708,428 |
| 3/31/2022 |
3 |
$9,305,799 |
$10,184,440 |
$10,703,039 |
$1,713,594 |
$1,713,594 |
$84,831,999 |
|
$1,166,560 |
81,718,264 |
$8,470,846 |
| 6/30/2022 |
6 |
$7,389,134 |
$8,317,155 |
$9,090,435 |
$1,277,094 |
$1,277,094 |
$84,831,999 |
|
$2,373,851 |
82,090,646 |
$7,040,061 |
| 9/30/2022 |
9 |
$6,023,983 |
$6,770,593 |
$7,499,011 |
$595,547 |
$595,547 |
$84,831,999 |
|
$3,271,474 |
80,287,868 |
$6,175,046 |
| 12/31/2022 |
12 |
$4,529,611 |
$5,550,521 |
$6,166,998 |
$782,903 |
$782,903 |
$84,831,999 |
0% |
$5,860,377 |
81,448,980 |
$4,767,618 |
| 3/31/2023 |
3 |
$4,003,116 |
$4,810,078 |
$5,390,103 |
$610,705 |
$610,705 |
$84,831,999 |
|
$609,719 |
80,622,313 |
$4,199,373 |
| 6/30/2023 |
6 |
$3,462,228 |
$3,896,399 |
$4,443,968 |
$182,724 |
$182,724 |
$84,831,999 |
|
$1,137,350 |
79,488,979 |
$3,713,675 |
| 9/30/2023 |
9 |
$3,514,392 |
$4,025,536 |
$4,542,780 |
$447,785 |
$447,785 |
$85,608,898 |
|
$2,146,631 |
92,039,477 |
$3,577,751 |
| Directors, Officers and Employees: |
5,224,642 |
6.6% |
AGM: June 8, 2023 |
| Other Insiders: |
9,877,143 |
12.5% |
People Tree Available |
| Past Reported Shareholders: |
20,597,463 |
N/A |
| Related Party |
Occupation |
Related
Since |
Insider |
Director |
Officer |
Capacity |
Ownership |
% |
| Jacques Bonneau |
Engineer |
6/5/2008 |
 |
|
|
|
687,562 |
0.9% |
| Jean-Sebastian David |
Mining Executive |
6/12/2014 |
|
|
|
CEO & President |
1,671,152 |
2.1% |
| Dawn M. Leach |
Administrator |
5/2/2018 |
|
|
|
|
0 |
0.0% |
| Raymond Z. Legault |
Consultant |
6/5/2008 |
|
|
|
|
605,385 |
0.8% |
| Mathieu Savard |
Geologist |
4/13/2021 |
|
|
|
|
0 |
0.0% |
| Serge Savard |
Athlete |
1/1/2001 |
|
|
|
Chairman |
1,209,913 |
1.5% |
| Claude Dufresne |
Metallurgist |
5/12/2014 |
|
|
|
Advisory Board |
1,050,630 |
1.3% |
| Jacquelin Gauthier |
Geologist |
11/22/2018 |
|
|
|
VP |
0 |
0.0% |
| Anthony Glavac |
Accountant |
12/11/2019 |
|
|
|
CFO |
0 |
0.0% |
| Osisko Development Corp |
Public Company |
6/22/2022 |
|
|
|
|
9,857,143 |
12.5% |
| Marc Pothier |
Lawyer |
12/17/2020 |
|
|
|
VP |
0 |
0.0% |
| Jean Rainville |
Engineer |
6/17/2016 |
|
|
|
|
20,000 |
0.0% |
| Relations Publiques Paradox Inc |
Investor Relations |
6/11/2020 |
|
|
|
IR |
0 |
0.0% |
| Philip Sutherland |
|
7/12/2021 |
|
|
|
Advisory Board |
0 |
0.0% |
| Derek Teevan |
ESG Specialist |
6/5/2020 |
|
|
|
VP |
0 |
0.0% |
| Past Insiders and Reported Shareholders - Current Ownership Status unknown - positions may be pre-rollback |
|---|
| Related Party |
Occupation |
Related
Since |
Insider
Ended |
Director
Ended |
|
Capacity |
Ownership |
|
| Marcel Bergeron |
|
5/24/2007 |
6/5/2008 |
6/5/2008 |
|
Director |
0 |
|
| Carlos H. Bertoni |
|
1/1/2001 |
5/24/2007 |
5/24/2007 |
|
Director |
16,370 |
|
| Marc Boisvert |
Engineer |
1/1/2013 |
6/12/2014 |
6/12/2014 |
|
Director |
408,000 |
|
| Claude Boulay |
|
5/31/2013 |
6/17/2016 |
6/17/2016 |
|
Director |
1,121,000 |
|
| Serge Bureau |
Engineer |
2/23/2010 |
5/27/2015 |
5/27/2015 |
|
Director |
757,395 |
|
| Richard Corbo |
Investor Relations |
1/1/2008 |
6/5/2020 |
|
|
VP Corp Dev |
0 |
|
| Evolution Group Inc |
Investor Relations |
9/11/2007 |
6/5/2020 |
|
|
IR |
0 |
|
| David A. Fennell |
Businessperson |
1/1/2001 |
5/24/2007 |
5/24/2007 |
|
Director |
0 |
|
| Dominique Fournier |
|
7/17/2006 |
9/11/2008 |
|
|
Insider |
0 |
|
| GBS Gold International Inc |
Public Company |
4/5/2007 |
|
|
|
Placee |
8,000,000 |
|
| Robert Getz |
Fund Manager |
12/18/2008 |
6/17/2010 |
6/17/2010 |
|
Director |
0 |
|
| Paul A. Girard |
Consultant |
1/1/1994 |
6/17/2010 |
6/17/2010 |
|
Director |
468,888 |
|
| Paul Gobeil |
Accountant |
4/22/2009 |
5/31/2013 |
5/31/2013 |
|
Director |
250,000 |
|
| Robert La Valliere |
|
6/17/2010 |
5/31/2013 |
5/31/2013 |
|
Director |
66,667 |
|
| Robert Lavalliere |
Investor Relations |
5/14/2012 |
6/5/2020 |
|
|
VP Corp Dev |
0 |
|
| Osisko Gold Royalties Ltd |
Public Company |
6/6/2018 |
6/22/2022 |
|
|
Insider |
9,857,143 |
|
| Gilbert E. Playford |
Mining Executive |
5/24/2007 |
10/6/2008 |
10/6/2008 |
|
Director |
0 |
|
| Louis M. Riopel |
Administrator |
5/24/2007 |
6/17/2010 |
6/17/2010 |
|
Director |
30,000 |
|
| Yves Therrien |
Accountant |
7/2/2007 |
6/5/2020 |
|
|
CFO |
0 |
|
| Anthony P. Walsh |
Retired |
1/1/2003 |
5/24/2007 |
5/24/2007 |
|
Director |
30,000 |
|
| Share positions of current insiders based on last AGM circular, ownership % based on current Issued. Share positions of past insiders and shareholders have not been adjusted for rollbacks or splits. |
Click here to view IPV Report
Key to Understanding the Spec Value Hunter Tables
 Flagship Play Flagship Play |
 Secondary Plays Secondary Plays |
 Other Plays Other Plays |
| A Spec Value Hunter table allows speculators to identify which projects offer poor, fair or good speculative value according to the rational speculation model. The speculative value depends on the project stage, the project's implied value as calculated by the company's fully diluted, stock price and net project interest, and the dream target deemed appropriate for the project. A dream target is what a project would be worth in discounted cash flow terms once in production. |
Poor Speculative Value -   |
Fair Speculative Value -  |
Good Speculative Value -   |
| Note: narrow arrows indicate IPV is outside the fair value channel but within 25% of the fair value limits |
Color Key for Target Outcome Achievability
Ranges in millions
ranked from most to least achievable |
| below $25 |
Should be Private: Artisanal, Placer, Mom & Pop Shop |
| $25-$50 |
Tiny Scale: underground mine or quarry - not worth the bother |
| $50-$100 |
Small Scale: junior needs to self-develop |
| $100-$250 |
Buyout Target: by Lower Tier Producers |
| $250-$500 |
Buyout Target: by Mid-Tier Producers |
| $500-$1,000 |
Ideal Target for Junior: Buckhorn, Sleeper |
| $1,000-$2,000 |
Almost World Class: Ekati, Red Chris, Brucejack, Juanicipio, Stibnite |
| $2,000-$5,000 |
World Class: Eskay Creek, Hemlo, Hermosa-Taylor, Oyu Tolgoi, LaRonde, McArthur |
| $5,000-$10,000 |
Giants: Escondida, Sullivan, Carlin Trend, Kidd Creek, Orapa, Kamoa-Kakula |
| above $10,000 |
Off the Scale District: Wits 1.0, Araxa, Sudbury Basin, Bayan Obo |
| The target outcome range required for the current implied project value to represent fair speculative value is based on the upper and lower certainty limits associated with the project stage. The color coding is based on the target outcome using the mid-point of the certainty range. |
Active Company Projects
| Project |
Location |
Net
Interest |
Stage |
IPV $
MM |
Fair Spec Value
Required Target
Outcome Range |
$100 |
UPV
$500 |
$2000 |
Target Metals |
Deposit Style |
|
James Bay |  |
Canada - Ontario - James Bay Lowlands |
100% WI |
6-Prefeasibility |
$6 |
$11 - $22 |
 |
|
|
Niobium | Carbonatite |
 |
Crevier | |
Canada - Quebec - Central Quebec |
72.5% WI |
7-Permitting & Feasibility |
$8 |
$10 - $15 |
|
|
|
Tantalum Niobium | Carbonatite |
|
Foothills | |
Canada - Quebec |
80% WI |
2-Target Drilling |
$7 |
$276 - $690 |
 |
 |
|
Titanium | Magmatic Intrusive |
|
Gouin | |
Canada - Quebec - Southern Quebec |
100% WI |
2-Target Drilling |
$6 |
$221 - $552 |
|
|
|
Niobium | Carbonatite |
|
Valentine | |
Canada - Ontario - James Bay Lowlands |
100% WI |
2-Target Drilling |
$6 |
$221 - $552 |
|
|
|
Niobium | Carbonatite |
| Project Stage | Flagship | Secondary | Active |
|---|
| Grassroots (1) & Target Testing (2) |
 |
 |
 |
| Discovery Delineation (3) |
 |
 |
 |
| Infill Drilling & Metallurgy (4) |
 |
 |
 |
| PEA (5) or PFS (6) |
 |
 |
 |
| Feasibility & Permitting (7) |
 |
 |
 |
| Construction (8) or Production (9) |
 |
 |
 |
| Clicking on the project icon will display a popup identifying the company project, its stage and target metals, basic facts, a chart, a link to that project within that company's KRO Profile, a link to the most recent news release, and a link to the most recent KRO comment if one exists. |
|
Net Interest: 100% WI
Vested: Yes
Uncapped NSR/GOR: 2.00% | Ownership Terms: Agreement Mar 4, 2016 to acquire 100% from Barrick (60%), James Bay Columbium Ltd (30%) and Goldcorp (10%) for $25,000 and 5 million shares, plus a 2% NSR of which half can be bought for $2 million anytime in constant 2016 dollars to a maximum of $3 million. Vendors can back-in for 51% by reimbursing 2.5X expenditures within 6 months of a resource equalling 2 million oz gold or gold equivalent. The gold equivalency does not apply to niobium content. The Moose Cree First Nation must be consulted on this project accroding to Ontario Ministry of Northern Development and Mines. Title is in the form of a mining lease with surface and mineral rights. Subject to a 2% NSR with a 1% buyback at $2 million. As part of a private placement of 9,000,000 shares at $0.26 on Mar 28, 2018 by Osisko Gold Royalties, NioBay granted Osisko the right to purchase a 1% NSR for $2 million within 90 days of a BFS, in effect a transfer of the buyback right from NioBay to Osisko. |
| Target Metals: Niobium | Model: Carbonatite | Stage: 6-Prefeasibility |
| Base Case Resource Estimates |
|---|
| Project Resource Estimate - James Bay |
| Jul 9, 2020 | NI 43-101 | Dorota El Rassi, P.Eng, Paul Chamois M.Sc, P.Geo, Roscoe Postle Associates | Cutoff: 0.3% Nb2O5 UG CAD $70/t OpEx, 70% recovery, USD $40/kg Nb |
| Note: Based on 86 holes 16,320 m. |
| Resource Category | Tonnage | Total
Rock Value | Metal | Grade | Recovery | Contained Metal | % of GMV |
| Indicated Resources | 29,700,000 | $248/t | Niobium | 5,300.00 g/t | 100.0% | 347,026,105 lb | 100% |
| Inferred Mineral Resources | 33,800,000 | $244/t | Niobium | 5,200.00 g/t | 100.0% | 387,480,517 lb | 100% |
| All Categories Spot | 63,500,000 | $246/t | Niobium | 5,246.77 g/t |
| 734,506,622 lb | 100% |
|---|
| Spot Gross Metal Value | Market Cap as % of Net GMV | Spot Prices Used |
| $15,608,265,707 | 0.0% | Niobium $21.25/lb |
| Outcome Visualization Project as of Apr 15, 2024: James Bay Underground |
| Project: | James Bay | Location: | Canada | Stage: | 6-Prefeasibility |
| Net Interest: | 100% WI | Uncapped NSR: | 2.0% | Target Metals: | Niobium |
| OV Project ID: | 1000020 | OVP Posted: | 4/10/2020 | OVP Retired: |
|
| Current OV ID: | 1000060 | Current OV Confirmed: | 10/20/2020 | Visualizer: | JK |
| Visualized Outcome: James Bay Niobium PEA 6,600 tpd UG Scenario |
| The James Bay niobium carbonatite deposit located 40 km south of the Moose Cree First Nations town of Moosonee in the James Bay Lowlands of northern Ontario was discovered in 1967. Bechtel completed a feasibility study in 1969 and updated it in 1979 but the project was never developed because of the remote location and the fact that CBMM had brought on stream the extraordinary Araxa deposit (5 times the resource and 5 times the grade), and the better located Niobec deposit in Quebec was developed. The deposit is unusual in that although it is similar in grade to the Niobec deposit, its coarser grained pyrochlore mineralization supports a recovery in the 70%-80% range compared to 50%-60% for Niobec and Araxa. The deposit was forgotten over the decades until NioBay Metals, which was already involved with the Crevier tantalum deposit in Quebec, purchased 100% of the deposit in 2016. Plans to do a PEA economic study were derailed when the chief who controlled the Moose Cree tribal council in Moosonee and who was in principle opposed to mining refused to engage in the consultations required by the Ontario mining ministry as a pre-condition for granting drill permits. This problem was not resolved until mid 2019 when a new group replaced the chief and her allies on the tribal council and secured a "protection agreement" allowing NioBay to proceed with a 7 hole drill program completed early 2020. The "social license" risk remains the dominant concern for this project advancing through feasibility and eventually being developed as the world's fourth major niobium mine. On Oct 13, 2020 NioBay published a PEA for a 6,600 tpd processing facility with 3 mining scenarios: open pit only, underground and open pit, and underground only. NioBay included an open-pit only scenario which has a 30 year mine life after feedback from the MCFN its community might prefer that option, in particular because there may be an opportunity for the MCFN to own and operate the 64 truck fleet needed for open-pit mining. This OV presents the Underground only scenario. |
| Source Note: The James Bay OV is based on the underground only scenario in the 43-101 compliant PEA published by NioBay Metals Inc on Oct 13, 20120. Costs were presented in CAD but have here been converted to USD using the 1.3 CAD:USD used by the PEA to convert the USD ferro-niobium price to CAD. |
| Visualized Outcome Summary: James Bay Niobium PEA 6,600 tpd UG Scenario |
| Deposit Scenario: 53,600,000 t @ 5,100.00 g/t Niobium |
| Mining Scenario: Underground 6,600 tpd 22.2 yrs, CapEx $445.0 million, SustCapEx $320.0 million, OpEx $51.50/t (USD) |
| LOM Payable: 329.0 million lb FeNb niobium |
| Economic Outcome (USD): Revenue Model at OV designated Metal Prices |
| Annual Average | Life of Mine (LOM) | LOM Stats |
| Recoverable Revenue: | $301,402,758 | $6,706,180,090 | $125/t ore Recoverable Value: |
| Smelter/Transport Costs: | $0 | $0 | 0.0% of Recoverable Revenue |
| Gross Payable Revenue: | $301,402,758 | $6,706,180,090 | 100.0% of Recoverable Revenue |
| Royalties: | ($6,028,055) | ($134,123,602) | 2.0% of Gross Payable Revenue |
| Net Payable Revenue: | $295,374,703 | $6,572,056,488 | 98.0% of Recoverable Revenue |
| Mining Cost: | ($54,563,850) | ($1,214,040,000) | 39% of OpEx - $22.65/t ore |
| Processing Cost: | ($50,974,440) | ($1,134,176,000) | 37% of OpEx - $21.16/t ore |
| Other Cost: | ($18,525,210) | ($412,184,000) | 13% of OpEx - $7.69/t ore |
| Sustaining Cost: | ($13,915,696) | ($320,061,000) | 10% of OpEx - $5.97/t ore |
| Total Operating Cost: | ($137,979,196) | ($3,080,461,000) | 47% of Net Payable Revenue - OpEx - $57.47/t ore |
| Pre-Tax Cash Flow: | $157,395,507 | $3,491,595,488 | 53% of Net Payable Revenue - $65.14/t ore |
| Taxes: | ($41,216,642) | ($913,934,546) | 26% of Pre-Tax Cash Flow - $17.05/t ore
|
| After-Tax Cash Flow: | $116,178,865 | $2,577,660,941 | 39% of Net Payable Revenue - $48.09/t ore |
| Note: Concentrate transport costs, smelter treatment costs and retention are subtracted from recoverable revenue to get gross payable revenue to which the uncapped royalty rate for the project is applied. The annual average of LOM sustaining cost is expensed as an annual operating cost. Annual average figures reflect full production years. |
| Economic Outcome (USD): Royalty Model for 1% NSR at OV designated Metal Prices |
| Mine Life: | 23 years | Startup | NPV 5% | NPV 10% | NPV 15% |
| Annual Avg NSR: | $2,953,747 | Now | $37,257,613 | $23,628,495 | $16,357,857 |
| LOM NSR: | $65,720,565 | 2025 | $35,483,441 | $21,480,450 | $14,224,223 |
| Economic Outcome - Discount Rate: 8.0% - CAD AT NPV: $948.0 million - Good Speculative Value |
| Gross Rock Value (USD/t): | $160 | Recoverable Rock Value: | $125 | Payable Rock Value: | $125 |
| LOM Net Payable Revenue (USD): | $6,572,056,488 | LOM PT Cash Flow (USD): | $3,491,595,488 | LOM AT Cash Flow (USD): | $2,577,660,941 |
| USD Pre-Tax NPV: | $1,079,004,971 | Pre-Tax IRR: | 35.3% | Pre-Tax Payback: | 2.8 |
| USD After-Tax NPV: | $688,577,849 | After-Tax IRR: | 25.9% | After-Tax Payback: | 3.8 |
| CAD Fair Spec Value Low: | $236,939,638 | CAD Fair Spec Value High: | $473,879,275 | CAD Implied Project Value: | $5,522,369 |
| Price Target if Visualized Outcome delivered by Expl-Dev Cycle without dilution: CAD $10.30 |
 |
| Fair Speculative Value Stock Price Range: CAD $2.57 - $5.15 |
| MSV (Market Cycle S Curve): Market Speculative Value represents the typical market pricing pattern of a new discovery as it moves through its exploration-development cycle. The irrational pricing behavior of the yellow channel contrasts with the fair speculative value of the blue channel as defined by the rational speculation model because during the pre-economic study stages there is great uncertainty about how big the discovery will turn out. |
Fair Speculative Value Ladder
| USD OV NPV | CAD OV NPV | Exch Rate | Diluted | Net Interest |
|---|
| $688,577,849 | $947,758,551 | 1.3764 | 92,039,477 | 100.00% |
|---|
| Project Stage | Uncertainty Range | CAD FSV Range | CAD FSV per Share Range | CAD MSV per Share Range |
|---|
| Grassroots |
0.5% - 1.0% |
$4,738,793 - $9,477,586 |
$0.05 - $0.10 |
$0.10 - $0.26 |
| Target Drilling |
1.0% - 2.5% |
$9,477,586 - $23,693,964 |
$0.10 - $0.26 |
$0.26 - $0.51 |
| Discovery Delineation |
2.5% - 5.0% |
$23,693,964 - $47,387,928 |
$0.26 - $0.51 |
$0.51 - $7.72 |
| Infill & Metallurgy |
5% - 10% |
$47,387,928 - $94,775,855 |
$0.51 - $1.03 |
$5.15 - $10.30 |
| PEA |
10% - 25% |
$94,775,855 - $236,939,638 |
$1.03 - $2.57 |
$2.57 - $7.72 |
| Prefeasibility |
25% - 50% |
$236,939,638 - $473,879,275 |
$2.57 - $5.15 |
$2.57 - $5.15 |
| Permitting & Feasibility |
50% - 75% |
$473,879,275 - $710,818,913 |
$5.15 - $7.72 |
$2.57 - $5.15 |
| Construction |
75% - 100% |
$710,818,913 - $947,758,551 |
$7.72 - $10.30 |
$5.15 - $7.72 |
| Production |
100% |
$947,758,551 |
$10.30 |
$10.30 - $12.87 |
 |
| Market Speculative Value Stock Price Range: CAD $2.57 - $5.15 |
| Warning: while the market spec value (S-Curve) and fair spec value channels presented in project value terms track the evolving expected ultimate outcome value, when presented in stock price terms the expected stock prices are subject to dilution through future equity financings or project interest farmouts. |
| Alternative Metal Price Scenarios |
| Metal 1 | Metal 2 | Metal 3 | Metal 4 |
| Niobium |
|
|
|
| Spot: | $21.25 /lb FeNb |
|
|
| | OV Assigned: | $20.41 /lb FeNb |
|
|
| | Pessimistic: | $15.00 /lb FeNb |
|
|
| | Optimistic: | $22.00 /lb FeNb |
|
|
| | Fantasy: | $25.00 /lb FeNb |
|
|
| | Note: for Metal 1 pessimistic, optimistic and fantasy price scenarios, OV assigned prices are used for Metals 2-4 |
| Economic Outcomes with Alternative Metal Price Scenarios |
| USD PT NPV | USD PT IRR | USD AT NPV | USD AT IRR | AT Payback yrs |
| Spot: | $1,194,304,072 | 38.1% | $769,287,219 | 27.9% | 3.6 |
| OV Assigned: | $1,079,004,971 | 35.3% | $688,577,849 | 25.9% | 3.8 |
| Pessimistic: | $336,423,859 | 17.2% | $168,975,892 | 12.8% | 7.3 |
| Optimistic: | $1,297,249,698 | 40.5% | $841,349,157 | 29.6% | 3.4 |
| Fantasy: | $1,709,032,200 | 50.3% | $1,129,596,909 | 36.5% | 2.7 |
| Fair Speculative Value for Alternative Metal Price Scenarios |
| Stage: Prefeasibility - 25.0% - 50.0% |
| CAD AT NPV | CAD Target Price | CAD FSV Range | CAD FSV per Share Range | CAD MSV per Share Range |
| Spot: | $1,058,846,928 | $11.50 | $264,711,732 - $529,423,464 | $2.88 - $5.75 | $2.88 - $5.75 |
| OV Assigned: | $947,758,551 | $10.30 | $236,939,638 - $473,879,275 | $2.57 - $5.15 | $2.57 - $5.15 |
| Pessimistic: | $232,578,418 | $2.53 | $58,144,605 - $116,289,209 | $0.63 - $1.26 | $0.63 - $1.26 |
| Optimistic: | $1,158,032,980 | $12.58 | $289,508,245 - $579,016,490 | $3.15 - $6.29 | $3.15 - $6.29 |
| Fantasy: | $1,554,777,185 | $16.89 | $388,694,296 - $777,388,593 | $4.22 - $8.45 | $4.22 - $8.45 |
| Disclaimer: A visualized outcome is one of many possible outcomes for an exploration project as it moves through the 9 stages of the exploration-development cycle from grassroots to a producing mine with failure as an outcome at any point along the way. The range of possible outcomes for the physical nature of a deposit shrinks after delivery of an initial 43-101 resource estimate. While the nature of the deposit constrains the range of mining scenarios, the cost assumptions will vary as the project moves through the feasibility demonstration stages of the cycle, which affects the economic value of the final outcome. This economic value will also vary according to the prices of the metals targeted for extraction which may change during the years it takes for a project to become a mine. An outcome visualization is thus a compilation of best guess assumptions for the key variables that drive the discounted cash flow model, the basis for assigning an economic value to a mine. An OV is not intended as a prediction, but rather as a framework that allows the incorporation of new information generated by the exploration-development cycle for the project into a valuation model on an ongoing, dynamic basis. |
.
| Outcome Visualization Project as of Apr 15, 2024: James Bay Open Pit |
| Project: | James Bay | Location: | Canada | Stage: | 6-Prefeasibility |
| Net Interest: | 100% WI | Uncapped NSR: | 2.0% | Target Metals: | Niobium |
| OV Project ID: | 1000028 | OVP Posted: | 10/20/2020 | OVP Retired: |
|
| Current OV ID: | 1000078 | Current OV Confirmed: | 10/20/2020 | Visualizer: | JK |
| Visualized Outcome: James Bay Niobium PEA 6,600 tpd OP Scenario |
| The James Bay niobium carbonatite deposit located 40 km south of the Moose Cree First Nations town of Moosonee in the James Bay Lowlands of northern Ontario was discovered in 1967. Bechtel completed a feasibility study in 1969 and updated it in 1979 but the project was never developed because of the remote location and the fact that CBMM had brought on stream the extraordinary Araxa deposit (5 times the resource and 5 times the grade), and the better located Niobec deposit in Quebec was developed. The deposit is unusual in that although it is similar in grade to the Niobec deposit, its coarser grained pyrochlore mineralization supports a recovery in the 70%-80% range compared to 50%-60% for Niobec and Araxa. The deposit was forgotten over the decades until NioBay Metals, which was already involved with the Crevier tantalum deposit in Quebec, purchased 100% of the deposit in 2016. Plans to do a PEA economic study were derailed when the chief who controlled the Moose Cree tribal council in Moosonee and who was in principle opposed to mining refused to engage in the consultations required by the Ontario mining ministry as a pre-condition for granting drill permits. This problem was not resolved until mid 2019 when a new group replaced the chief and her allies on the tribal council and secured a "protection agreement" allowing NioBay to proceed with a 7 hole drill program completed early 2020. The "social license" risk remains the dominant concern for this project advancing through feasibility and eventually being developed as the world's fourth major niobium mine. On Oct 13, 2020 NioBay published a PEA for a 6,600 tpd processing facility with 3 mining scenarios: open pit only, underground and open pit, and underground only. NioBay included an open-pit only scenario which has a 30 year mine life after feedback from the MCFN that its community might prefer that option, in particular because there may be an opportunity for the MCFN to own and operate the 64 truck fleet needed for open-pit mining. This OV presents the Open Pit only scenario. |
| Source Note: The James Bay OV is based on the open pit only scenario in the 43-101 compliant PEA published by NioBay Metals Inc on Oct 13, 20120. Costs were presented in CAD but have here been converted to USD using the 1.3 CAD:USD exchange rate used by the PEA to convert the USD ferro-niobium price to CAD. The conversion of the USD NPV into CAD to allow a per share calculation is done at the current exchange rate. |
| Visualized Outcome Summary: James Bay Niobium PEA 6,600 tpd OP Scenario |
| Deposit Scenario: 70,800,000 t @ 4,400.00 g/t Niobium |
| Mining Scenario: Open Pit 6,600 tpd 29.4 yrs, CapEx $393.0 million, SustCapEx $220.0 million, OpEx $37.30/t (USD) |
| LOM Payable: 374.0 million lb FeNb niobium |
| Economic Outcome (USD): Revenue Model at OV designated Metal Prices |
| Annual Average | Life of Mine (LOM) | LOM Stats |
| Recoverable Revenue: | $260,033,752 | $7,642,336,924 | $108/t ore Recoverable Value: |
| Smelter/Transport Costs: | $0 | $0 | 0.0% of Recoverable Revenue |
| Gross Payable Revenue: | $260,033,752 | $7,642,336,924 | 100.0% of Recoverable Revenue |
| Royalties: | ($5,200,675) | ($152,846,738) | 2.0% of Gross Payable Revenue |
| Net Payable Revenue: | $254,833,077 | $7,489,490,185 | 98.0% of Recoverable Revenue |
| Mining Cost: | ($23,001,132) | ($675,998,400) | 24% of OpEx - $9.55/t ore |
| Processing Cost: | ($48,324,540) | ($1,420,248,000) | 50% of OpEx - $20.06/t ore |
| Other Cost: | ($18,525,210) | ($544,452,000) | 19% of OpEx - $7.69/t ore |
| Sustaining Cost: | ($7,337,500) | ($220,125,000) | 8% of OpEx - $3.11/t ore |
| Total Operating Cost: | ($97,188,382) | ($2,860,823,400) | 38% of Net Payable Revenue - OpEx - $40.41/t ore |
| Pre-Tax Cash Flow: | $157,644,695 | $4,628,666,785 | 62% of Net Payable Revenue - $65.38/t ore |
| Taxes: | ($43,285,333) | ($1,270,803,536) | 27% of Pre-Tax Cash Flow - $17.95/t ore
|
| After-Tax Cash Flow: | $114,359,362 | $3,357,863,250 | 45% of Net Payable Revenue - $47.43/t ore |
| Note: Concentrate transport costs, smelter treatment costs and retention are subtracted from recoverable revenue to get gross payable revenue to which the uncapped royalty rate for the project is applied. The annual average of LOM sustaining cost is expensed as an annual operating cost. Annual average figures reflect full production years. |
| Economic Outcome (USD): Royalty Model for 1% NSR at OV designated Metal Prices |
| Mine Life: | 30 years | Startup | NPV 5% | NPV 10% | NPV 15% |
| Annual Avg NSR: | $2,548,331 | Now | $36,965,993 | $21,757,982 | $14,529,393 |
| LOM NSR: | $74,894,902 | 2025 | $35,205,708 | $19,779,984 | $12,634,255 |
| Economic Outcome - Discount Rate: 8.0% - CAD AT NPV: $1.1 billion - Good Speculative Value |
| Gross Rock Value (USD/t): | $138 | Recoverable Rock Value: | $108 | Payable Rock Value: | $108 |
| LOM Net Payable Revenue (USD): | $7,489,490,185 | LOM PT Cash Flow (USD): | $4,628,666,785 | LOM AT Cash Flow (USD): | $3,357,863,250 |
| USD Pre-Tax NPV: | $1,270,435,280 | Pre-Tax IRR: | 40.1% | Pre-Tax Payback: | 2.5 |
| USD After-Tax NPV: | $821,788,487 | After-Tax IRR: | 29.1% | After-Tax Payback: | 3.4 |
| CAD Fair Spec Value Low: | $282,777,418 | CAD Fair Spec Value High: | $565,554,837 | CAD Implied Project Value: | $5,522,369 |
| Price Target if Visualized Outcome delivered by Expl-Dev Cycle without dilution: CAD $12.29 |
 |
| Fair Speculative Value Stock Price Range: CAD $3.07 - $6.14 |
| MSV (Market Cycle S Curve): Market Speculative Value represents the typical market pricing pattern of a new discovery as it moves through its exploration-development cycle. The irrational pricing behavior of the yellow channel contrasts with the fair speculative value of the blue channel as defined by the rational speculation model because during the pre-economic study stages there is great uncertainty about how big the discovery will turn out. |
Fair Speculative Value Ladder
| USD OV NPV | CAD OV NPV | Exch Rate | Diluted | Net Interest |
|---|
| $821,788,487 | $1,131,109,674 | 1.3764 | 92,039,477 | 100.00% |
|---|
| Project Stage | Uncertainty Range | CAD FSV Range | CAD FSV per Share Range | CAD MSV per Share Range |
|---|
| Grassroots |
0.5% - 1.0% |
$5,655,548 - $11,311,097 |
$0.06 - $0.12 |
$0.12 - $0.31 |
| Target Drilling |
1.0% - 2.5% |
$11,311,097 - $28,277,742 |
$0.12 - $0.31 |
$0.31 - $0.61 |
| Discovery Delineation |
2.5% - 5.0% |
$28,277,742 - $56,555,484 |
$0.31 - $0.61 |
$0.61 - $9.22 |
| Infill & Metallurgy |
5% - 10% |
$56,555,484 - $113,110,967 |
$0.61 - $1.23 |
$6.14 - $12.29 |
| PEA |
10% - 25% |
$113,110,967 - $282,777,418 |
$1.23 - $3.07 |
$3.07 - $9.22 |
| Prefeasibility |
25% - 50% |
$282,777,418 - $565,554,837 |
$3.07 - $6.14 |
$3.07 - $6.14 |
| Permitting & Feasibility |
50% - 75% |
$565,554,837 - $848,332,255 |
$6.14 - $9.22 |
$3.07 - $6.14 |
| Construction |
75% - 100% |
$848,332,255 - $1,131,109,674 |
$9.22 - $12.29 |
$6.14 - $9.22 |
| Production |
100% |
$1,131,109,674 |
$12.29 |
$12.29 - $15.36 |
 |
| Market Speculative Value Stock Price Range: CAD $3.07 - $6.14 |
| Warning: while the market spec value (S-Curve) and fair spec value channels presented in project value terms track the evolving expected ultimate outcome value, when presented in stock price terms the expected stock prices are subject to dilution through future equity financings or project interest farmouts. |
| Alternative Metal Price Scenarios |
| Metal 1 | Metal 2 | Metal 3 | Metal 4 |
| Niobium |
|
|
|
| Spot: | $21.25 /lb FeNb |
|
|
| | OV Assigned: | $20.41 /lb FeNb |
|
|
| | Pessimistic: | $15.00 /lb FeNb |
|
|
| | Optimistic: | $22.00 /lb FeNb |
|
|
| | Fantasy: | $25.00 /lb FeNb |
|
|
| | Note: for Metal 1 pessimistic, optimistic and fantasy price scenarios, OV assigned prices are used for Metals 2-4 |
| Economic Outcomes with Alternative Metal Price Scenarios |
| USD PT NPV | USD PT IRR | USD AT NPV | USD AT IRR | AT Payback yrs |
| Spot: | $1,379,171,821 | 42.8% | $897,904,066 | 31.0% | 3.2 |
| OV Assigned: | $1,270,435,280 | 40.1% | $821,788,487 | 29.1% | 3.4 |
| Pessimistic: | $570,120,174 | 22.9% | $331,567,913 | 16.9% | 5.9 |
| Optimistic: | $1,476,258,019 | 45.2% | $965,864,405 | 32.7% | 3.1 |
| Fantasy: | $1,864,602,809 | 54.7% | $1,237,705,758 | 39.3% | 2.5 |
| Fair Speculative Value for Alternative Metal Price Scenarios |
| Stage: Prefeasibility - 25.0% - 50.0% |
| CAD AT NPV | CAD Target Price | CAD FSV Range | CAD FSV per Share Range | CAD MSV per Share Range |
| Spot: | $1,235,875,157 | $13.43 | $308,968,789 - $617,937,578 | $3.36 - $6.71 | $3.36 - $6.71 |
| OV Assigned: | $1,131,109,674 | $12.29 | $282,777,418 - $565,554,837 | $3.07 - $6.14 | $3.07 - $6.14 |
| Pessimistic: | $456,370,076 | $4.96 | $114,092,519 - $228,185,038 | $1.24 - $2.48 | $1.24 - $2.48 |
| Optimistic: | $1,329,415,766 | $14.44 | $332,353,942 - $664,707,883 | $3.61 - $7.22 | $3.61 - $7.22 |
| Fantasy: | $1,703,578,205 | $18.51 | $425,894,551 - $851,789,103 | $4.63 - $9.25 | $4.63 - $9.25 |
| Disclaimer: A visualized outcome is one of many possible outcomes for an exploration project as it moves through the 9 stages of the exploration-development cycle from grassroots to a producing mine with failure as an outcome at any point along the way. The range of possible outcomes for the physical nature of a deposit shrinks after delivery of an initial 43-101 resource estimate. While the nature of the deposit constrains the range of mining scenarios, the cost assumptions will vary as the project moves through the feasibility demonstration stages of the cycle, which affects the economic value of the final outcome. This economic value will also vary according to the prices of the metals targeted for extraction which may change during the years it takes for a project to become a mine. An outcome visualization is thus a compilation of best guess assumptions for the key variables that drive the discounted cash flow model, the basis for assigning an economic value to a mine. An OV is not intended as a prediction, but rather as a framework that allows the incorporation of new information generated by the exploration-development cycle for the project into a valuation model on an ongoing, dynamic basis. |
.
Net Interest: 72.5% WI
Vested: No
Uncapped NSR/GOR: 0.00% | Ownership Terms: April 14, 2009 agreement where MDN has the option to acquire up to a 75% interest in Les Mines Crevier (MCI). Upon completion of due diligence, MDN will purchase 25% of MCI shares for $750,000, and complete a $1.5 million financing in order for MCI to redeem an outstanding debenture. MDN will subsequently finance exploration and development expenses necessary to advancing the project to the construction stage. In June 2009 MDN agreed to pursue the transaction, acquiring 28.75 per cent of the shares of MCI as well as the entire $1.5-million in convertible debentures, for a total amount of $2,325,000. In addition, the transaction also calls for MDN to invest up to $7.5-million over three years to finance a feasibility study on developing the resource. Over the same period, MDN may raise its ownership in MCI up to 75 per cent, in return for a further $3.5-million investment. The other partners in the project are Iamgold (37.5 per cent), Dresden Mining Inc. (11.25 per cent) and MCI management (22.5 per cent). In June 2011 98 square kilometers of additional ground was staked to the southeast to cover a magnetic geophysical response similar to the one associated with the Niobec niobium mine. Niobec Inc (Magris Resources Inc) owns 27.5%. |
| Target Metals: Tantalum Niobium | Model: Carbonatite | Stage: 7-Permitting & Feasibility |
| Base Case Resource Estimates |
|---|
| Project Resource Estimate - Anita |
| Jun 14, 2010 | NI 43-101 | SGS Geostat | Cutoff: 0.1% Nb |
| Resource Category | Tonnage | Total
Rock Value | Metal | Grade | Recovery | Contained Metal | % of GMV |
| Measured Resource | 12,465,000 | $132/t | Niobium | 1,990.00 g/t | 100.0% | 54,685,878 lb | 71% |
| Tantalum | 234.00 g/t | 100.0% | 6,430,400 lb | 29% |
| Indicated Resources | 12,904,000 | $130/t | Niobium | 1,940.00 g/t | 100.0% | 55,189,430 lb | 70% |
| Tantalum | 234.00 g/t | 100.0% | 6,656,869 lb | 30% |
| Inferred Mineral Resources | 15,423,000 | $122/t | Niobium | 1,700.00 g/t | 100.0% | 57,802,631 lb | 66% |
| Tantalum | 252.00 g/t | 100.0% | 8,568,390 lb | 34% |
| All Categories Spot | 40,792,000 | $127/t | Niobium | 1,864.54 g/t |
| 167,677,939 lb | 69% |
|---|
| Tantalum | 240.81 g/t |
| 21,655,659 lb | 31% |
|---|
| Spot Gross Metal Value | Market Cap as % of Net GMV | Spot Prices Used |
| $5,198,158,461 | 0.1% | Niobium $21.25/lb, Tantalum $75.50/lb |
Net Interest: 80% WI
Vested: No
Uncapped NSR/GOR: 0.00% | Ownership Terms: According to the terms of the deal, Iluka Resources Limited (ASX: ILU) may earn an initial 51% interest (the First Option) in the Foothills property by incurring exploration expenditures totalling $400,000 during the first year of the agreement. Vior will be project operator during this period. After earning an initial 51% interest, Iluka may elect to increase its interest to 90% (the Second Option) over another two-year period, by incurring an additional $2,200,000 in exploration expenditures. Iluka spent $3,380,963 before dropping the option on Sept 21, 2022. Agreement Feb 7, 2024 where by Vior options 80% to NioBay Metals for $400,000 and 5.5 million shares by Dec 31, 2027. |
| Target Metals: Titanium | Model: Magmatic Intrusive | Stage: 2-Target Drilling |
| Gouin Project |
 Featured in Share Collective Featured in Share Collective |
| Gouin | | Canada | QC | Southern Quebec | 11,650 ha |
Net Interest: 100% WI
Vested: No
Uncapped NSR/GOR: 0.00% | Ownership Terms: Agreement May 10, 2021 to option 100% of Gouin East and Gouin West from Les Ressources Tectonic Inc for $190,000, $430,000 in cash or stock at NioBay's option, and $1,650,000 exploration over 6 years. Vendor gets 1% NSR upon NioBay vesting which NioBay can buy back for $1.5 million, though NioBay can buy it for $250,000 during the option period. |
| Target Metals: Niobium | Model: Carbonatite | Stage: 2-Target Drilling |
| Valentine Project |
| Featured in Share Collective |
| Valentine | | Canada | ON | James Bay Lowlands | 0 ha |
Net Interest: 100% WI
Vested: Yes
Uncapped NSR/GOR: 0.00% | Ownership Terms: Acquired by staking in Q1 of 2019. |
| Target Metals: Niobium | Model: Carbonatite | Stage: 2-Target Drilling |
 |
| Apr 21, 2023 | Kaiser Watch - 0:15:23 |
| Apr 21, 2023 | KW Excerpt: Kaiser Watch April 21, 2023: NioBay Metals Inc (NBY-V) |
| Mar 24, 2023 | Kaiser Watch - 0:09:08 |
| Mar 24, 2023 | KW Excerpt: Kaiser Watch March 24, 2023: NioBay Metals Inc (NBY-V) |
| Feb 23, 2023 | Kaiser Watch - 0:00:00 |
| Feb 23, 2023 | KW Excerpt: Kaiser Watch February 23, 2023: NioBay Metals Inc (NBY-V) |
| Jan 6, 2023 | Kaiser Watch - 0:53:55 |
| Jan 6, 2023 | KW Excerpt: Kaiser Watch January 6, 2023: NioBay Metals Inc (NBY-V) |
| Dec 19, 2022 | Tracker: Speculative Value Rating for NioBay Metals Inc |
| Nov 10, 2022 | KW Excerpt: Kaiser Watch November 10, 2022: NioBay Metals Inc (NBY-V) |
| Nov 10, 2022 | Kaiser Watch - 0:00:00 |
| Oct 21, 2021 | Discovery Watch with HoweStreet.com - 0:16:02 |
| May 12, 2021 | Discovery Watch with HoweStreet.com - 0:25:26 |
| Apr 9, 2021 | Tracker: What's Next for NioBay Metals Inc? |
| Apr 9, 2021 | Tracker: Spec Value Rating for NioBay Metals Inc |
| Apr 8, 2021 | Discovery Watch with HoweStreet.com - 0:12:40 |
| Feb 17, 2021 | Discovery Watch with HoweStreet.com - 0:15:51 |
| Feb 15, 2021 | Tracker: The basis for a $3-$6 price target for NioBay Metals Inc |
| Feb 9, 2021 | Discovery Watch with HoweStreet.com - 0:18:02 |
| Dec 17, 2020 | Discovery Watch with HoweStreet.com - 0:18:15 |
| Nov 19, 2020 | Discovery Watch with HoweStreet.com - 0:21:51 |
| Oct 20, 2020 | Tracker: Outcome Visualization: NioBay's James Bay Niobium Project: PEA 6,600 tpd Open Pit Scenario |
| Oct 20, 2020 | Tracker: Outcome Visualization: NioBay's James Bay Niobium Project: PEA 6,600 tpd Underground Scenario |
| Oct 15, 2020 | Discovery Watch with HoweStreet.com - 0:00:01 |
| Aug 3, 2020 | Tracker: What's Next for NioBay Metals Inc? |
| Jul 17, 2020 | Tracker: Spec Value Rating Overview for NioBay Metals Inc |
| Jul 15, 2020 | Discovery Watch with HoweStreet.com - 0:00:01 |
| Jul 10, 2020 | Tracker: Outcome Visualization for the James Bay Niobium project of NioBay Metals Inc |
| May 7, 2020 | Discovery Watch with HoweStreet.com - 0:22:35 |
| Apr 9, 2020 | Tracker: Outcome Visualization for the James Bay Niobium project of NioBay Metals Inc |
| Apr 9, 2020 | Tracker: New Spec Value Rating for NioBay Metals Inc |
| Apr 8, 2020 | Discovery Watch with HoweStreet.com - 0:19:23 |
| Mar 26, 2020 | Discovery Watch with HoweStreet.com - 0:09:36 |
| Jan 9, 2020 | Discovery Watch with HoweStreet.com - 0:07:53 |
| Nov 5, 2019 | Discovery Watch with HoweStreet.com - 0:00:01 |
| Jul 4, 2019 | Tracker: New Moose Cree First Nation chief and council pave way for social license consultations |
| Jul 4, 2019 | Discovery Watch with HoweStreet.com - 0:13:14 |
| Apr 9, 2019 | Discovery Watch with HoweStreet.com - 0:09:49 |
| Mar 21, 2019 | Tracker: Moose Cree First Nation power struggle to be decided by General Election |
| Feb 5, 2019 | Discovery Watch with HoweStreet.com - 0:14:59 |
| Jan 31, 2019 | Tracker: NioBay clears drill permitting hurdle but still needs social license for James Bay niobium project |
| Jan 15, 2019 | Tracker: Spec Value Rating for NioBay Metals Inc |
| Feb 19, 2009 | Bottom-Fish Comment: Recommendation Strategy for MDN Inc |
| Feb 29, 2024 | Property Asset or Share Purchase Agreement |
| Feb 29, 2024 | Intercepts Historical Grades on Its Crevier Project and Confirms the Extension of the Mineralized Zone |
| Feb 21, 2024 | Closes Option Agreement to Acquire Foothills Property |
| Feb 7, 2024 | NioBay Metals Signs Option Agreement to Acquire High Potential Titanium and Phosphate Properties |
| Jan 18, 2024 | Corporate Update on NioBay Activities |
| Jan 8, 2024 | Intercepts Niobium in the Extension of Its Main Zone at Crevier |
| Aug 29, 2023 | Commences 2023 Drilling Campaign at the Crevier Project |
| Jul 27, 2023 | Private Placement Non Brokered |
| Jul 20, 2023 | Closes Financing |
| Jun 9, 2023 | Election of Directors |
| Apr 20, 2023 | Presence of Mineralization West of the Known Zone on the Crevier Property |
| Feb 28, 2023 | Signing of a Cooperation Agreement with the Pekuakamiulnuatsh Nation for the Crevier Project |
| Feb 13, 2023 | Corporate Update on NioBay Activities |
| Feb 8, 2023 | Dawn Madahbee Leach Recipient of the 2023 Business Lifetime Achievement Award From CCAB |
| Jan 25, 2023 | Update on Metallurgical Progress at the Crevier Project |
| Dec 14, 2022 | Corporate Update of NioBay Activities |
| Oct 24, 2022 | Corporate Update |
| Oct 18, 2022 | Update on high volume of trading |
| Sep 13, 2022 | Begins Drilling Following Significant Prospecting Results On Crevier |
| Aug 23, 2022 | Begins Overburden and Bedrock Drilling Program On The East Gouin property in Quebec |
| Aug 11, 2022 | Confirms Mineralization to the North at Depth at the James Bay Niobium Project |
| Jun 23, 2022 | Election of Directors |
| Apr 28, 2022 | Provides Update on its Activities |
| Mar 17, 2022 | Suspends exploration at the James Bay Niobium Project |
| Feb 23, 2022 | Confirms commencement of drilling at James Bay Niobium |
| Jan 20, 2022 | Finalize the Sale of Properties to SOQUEM |
| Jan 10, 2022 | Agreement with Tribal Logistics/Expedition Helicopter and updated agreement with Moose Cree First Nation |
| Oct 20, 2021 | Comes to an agreement with SOQUEM for the sale of properties |
| Oct 14, 2021 | Improves Recovery and Concentrate for Production of Niobium Batteries from its James Bay Niobium Project |
| Sep 17, 2021 | Couloir Capital Ltd. Is Pleased to Announce the Initiation of Research Coverage on Niobay Metals Inc. |
| Sep 9, 2021 | Corporate Changes |
| Aug 27, 2021 | Update on the Drill Program at its James Bay Niobium Project |
| Jul 12, 2021 | Nominates Philip Sutherland as Indigenous Advisor and Provides Update on James Bay Niobium Project |
| May 26, 2021 | NioBay Director Appointed Chair of the National Indigenous Economic Development Board |
| May 11, 2021 | Property Asset or Share Purchase Agreement |
| May 10, 2021 | Option Agreement to Acquire Two Properties with Niobium Potential |
| Apr 13, 2021 | Appoints Mathieu Savard to its Board of Directors |
| Apr 6, 2021 | Initiates Test Works for the Production of Battery Grade Niobium |
| Feb 25, 2021 | Begins Trading on the OTCQB Venture Market in the U.S. |
| Feb 16, 2021 | Filing of an Application for OTCQB Listing and Provides Drill Program Update |
| Feb 1, 2021 | Moose Cree First Nation and NioBay Metals Announce Renewal of the Protection Agreement |
| Dec 22, 2020 | Private Placement Brokered |
| Dec 17, 2020 | Completion of Royalty Sale and Provides a Corporate Update |
| Dec 8, 2020 | Closing of $11.6 M Brokered Private Placement |
| Nov 27, 2020 | Files Positive James Bay Niobium PEA |
| Nov 25, 2020 | Closes Sale of Property and Provides Corporate Update |
| Nov 17, 2020 | 20% Increase to Previously Announced Private Placement |
| Nov 16, 2020 | $10 Million Private Placement |
| Nov 4, 2020 | Begins Magnetic Surveys on James Bay Niobium and Valentine Properties |
| Oct 14, 2020 | James Bay Niobium PEA Delivers an After Tax NPV(8%) of $1.0 Billion and IRR of 27.5% |
| Oct 13, 2020 | James Bay Niobium PEA Delivers an After Tax NPV(8%) of $1.0 Billion and IRR of 27.5% |
| Sep 29, 2020 | Sells Property and Provides James Bay Project Update |
| Aug 25, 2020 | Files Mineral Resource Estimate for James Bay Niobium |
| Aug 13, 2020 | A Significant Recovery Rate at James Bay Niobium |
| Jul 9, 2020 | A Significant Increase in Resources at James Bay Niobium |
| Jun 16, 2020 | Provides Corporate Update |
| Jun 11, 2020 | Engages Paradox to Provide Investor Relations Services |
| Jun 5, 2020 | Nomination of Derek Teevan and the Results of AGM |
| May 21, 2020 | Extends High Grade Mineralization at James Bay Niobium |
| Apr 8, 2020 | NIOBAY INTERSECTS 1.02% NbO5 OVER 62 METRES AT JAMES BAY NIOBIUM |
| Mar 25, 2020 | Completion of the Winter Drill Program at Niobay's James Bay Niobium Project |
| Feb 10, 2020 | Drilling Program is Underway at James Bay Niobium Project |
| Jan 23, 2020 | Update on the Drill Program and Closing of a Financing |
| Dec 24, 2019 | Moose Cree First Nation And NioBay Metals Announce The Signing Of A Protection Agreement |
| Dec 23, 2019 | Completion of $2.3 Million Private Placement |
| Dec 11, 2019 | Provides Corporate Update |
| Oct 18, 2019 | Withdrawal of Legal Challenge to the Exploration Permit |
| Jun 26, 2019 | Initiates Metallurgical Test Work at Its Crevier Project |
| Jun 6, 2019 | Results of Annual Shareholders Meeting |
| Mar 6, 2019 | Update on the Exploration Permit for the James Bay Niobium Project |
| Jan 30, 2019 | The Receipt of Its Exploration Permit for the James Bay Niobium Project |
| Nov 22, 2018 | The Appointment of a Vice President, Geology and Provides an Update on Projects |
| May 2, 2018 | The Appointment of a New Director and a Grant of Stock Options |
| Apr 27, 2018 | Provides A Corporate Update |
| Apr 6, 2018 | Midland and Niobay Identify Good Potential for Bousquet LaRonde Type Gold Occurrences on La Peltrie |
| Apr 2, 2018 | Early Warning News Release |
| Mar 28, 2018 | Closing of Private Placement with Osisko Gold Royalties |
| Mar 27, 2018 | Halted Security |
| Mar 27, 2018 | Private Placement with Osisko Gold Royalties |
| Dec 22, 2017 | Completion Of Financing And Provides A Corporate Update |
| Nov 16, 2017 | Reports Initial Resource Estimate For James Bay Niobium Project |
| Oct 10, 2017 | Niobay And Midland Commence Drilling Campaign On La Peltrie |
| Sep 6, 2017 | Option To Acquire Up To 65% In The La Peltrie Gold Project From Midland Exploration, Southeast Of Detour Gold's Zone 58n |
| Jun 12, 2017 | Provides An Update On The Exploration Permit Application At The James Bay Niobium Project |
| May 10, 2017 | Initial Metallurgical Test Results From Its James Bay Niobium Project And Upcoming Information Session At Moosonee |
| Apr 10, 2017 | Provides Further Results From Re assaying Program At James Bay Niobium Project |
| Mar 6, 2017 | Provides Initial Results From Re Assaying Program At James Bay Niobium Project |
| Jan 16, 2017 | Private Placement Non Brokered |
| Dec 22, 2016 | Adoption Of New Stock Option Plan |
| Dec 20, 2016 | Closing Of Flow Through Financing |
| Dec 12, 2016 | Flow through Financing Of Up To $1,000,000 |
| Sep 20, 2016 | Name Change and Consolidation |
| Sep 20, 2016 | Name Change, New Stock Symbol And Share Consolidation |
| Sep 2, 2016 | Results From Special Shareholder Meeting |
| Aug 9, 2016 | Private Placement Non Brokered |
| Aug 4, 2016 | Closing Of Non brokered Private Placement Of $1,795,000 |
| Jul 26, 2016 | Private Placement Of Up To $1,400,000 |
| Jul 19, 2016 | Special Meeting Of Shareholders |
| Jun 28, 2016 | Closes Acquisition Of James Bay Niobium (argor) Property |
| Jun 17, 2016 | Appointment Of Jean Rainville As New Director |
| Jun 7, 2016 | MDN Signs Binding Agreement To Acquire The Argor Property |
| May 26, 2016 | Appointment Of CFO And AGM Results |
| May 4, 2016 | Terminates The HOA With XINYE |
| Mar 30, 2016 | New Listing Shares |
| Mar 22, 2016 | Bulletin 2016 0276: Changes In Stock List |
| Mar 16, 2016 | Lists On The Tsx Venture Exchange |
| Mar 4, 2016 | Signs A Loi For The Acquisition Of The Argor Niobium Deposit |
| Jan 11, 2016 | Xinye Intends To Proceed With Jv In Tanzania |
| Dec 11, 2015 | Update On The Company And Its Operations |
| Oct 22, 2015 | Discovers New Carbonatite With High Grade Niobium Values At Prairie Lake |
| Sep 8, 2015 | Signs An Agreement For A Joint Venture On The Ikungu Properties In Tanzania |
| Jun 25, 2015 | Confirmation Of High grade Niobium Showings And Discovery Of New Carbonatites |
| May 27, 2015 | The Annual Shareholders' Meeting Results |
| May 27, 2015 | Prospecting Work Begin On Prairie Lake |
| May 14, 2015 | Interpretation Of Exploration Results On Samaqua |
| Apr 24, 2015 | Prairie Lake Earns Discovery Of The Year In Northwestern Ontario |
| Apr 16, 2015 | Receives Cash From Dispute Settlement |
| Feb 26, 2015 | Bulletin 2015 0166; Change in Transfer Agent |
| Feb 24, 2015 | Acquires 20 Blocks Of High Grade Niobium Claims In Ontario |
| Jan 30, 2015 | Start Of Drilling Program On Samaqua |
| Dec 15, 2014 | Update On The Exploration Program On Samaqua |
| Oct 15, 2014 | Identifies Three Large Exploration Targets On Samaqua |
| Oct 6, 2014 | Welcomes Positively The Change Of Partner In The Crevier Project |
| Aug 19, 2014 | The Start Of The Exploration Program On Samaqua |
| Jul 15, 2014 | Closing Of Private Placement |
| Jun 18, 2014 | An Exploration Program On The Samaqua Property |
| Jun 12, 2014 | Jean Sebastien David And Claude Dufresne Are Joining The Board Of Directors Of MDN Inc. |
| May 14, 2014 | Ikungu East Exploration Results Update |
| May 12, 2014 | Claude Dufresne Appointed President And Chief Executive Officer |
| Mar 31, 2014 | Increasing Evidence Of A Large Gold bearing System At Its Nikonga Project |
| Dec 20, 2013 | Tanzania Minerals Corp. And MDN Inc. Agree To Not Further Advance Ikungu Letter Of Intent |
| Nov 15, 2013 | Sale And Transfer Of Tulawaka Mine To Stamico |
| Nov 8, 2013 | Crevier Project Update: New Focus For The Feasibility Study |
| Oct 15, 2013 | TZM Entered Into Letter of Intent with MDN For 50% Interest In the Ikungu Gold Project in Tanzania |
| Oct 15, 2013 | Ikungu Project: Mdn Signs A Letter Of Intent With Tanzania Minerals Corp. |
|