| Kaiser Watch April 14, 2023: $2,000 still a ceiling or a new base for gold? |
| Jim (0:00:00): Will $2,000 become the new base for gold or remain a ceiling it never really breaks through? |
Gold managed to spend the past week above $2,000, injecting life into resource juniors across the board whether focused on gold or other metals. But the market interest remains fickle, especially among retail investors who lack conviction that gold will undergo a sustained rally beyond $2,000, which, when it eventually stalls, will not crash back through $2,000 and plumb the $1,700-$1,800 per oz range. One cannot blame retail investors for viewing $2,000 as a ceiling for gold rather than soon to become a base for gold as speculation shifts to $3,000 as the next target. When the reality of covid hit in March 2020 and the Federal Reserve unleashed massive quantitative easing to prevent an economic free fall into a depression, retail piled into gold which rallied above $2,000 before stalling in September 2020. When Russia invaded Ukraine in late February retail piled into gold once again, but got blindsided when the Federal Reserve began its rapid interest rate increases to tame inflation that had become persistent rather than just a temporary supply-chain related problem.
Since then there has been a trend of declining gold holdings for the World Gold Council backed GLD ETF which has a mechanism in place that allows a dozen or so designated bankers to either submit physical gold in exchange for GLD paper or submit GLD paper in exchange for physical gold. Initially established as representing one tenth of an ounce of gold, a GLD share is less these days because of administrative costs, but the bankers know exactly how much gold a GLD share represents and engage in arbitrage activities between the bullion and GLD ETF markets. When there is great GLD demand that results in premium pricing relative to physical gold, the bankers short the GLD and buy physical gold to capture the margin. When there is GLD selling pressure the bankers buy GLD paper and short physical gold in the bullion market. When either GLD trend persists, the bankers unwind their short position by either delivering GLD paper to the ETF in exchange for physical gold which they use to cover their physical short position, or deliver physical gold to the ETF which prints GLD paper in exchange.
A chart tracking the holdings and daily volume of the GLD ETF does not tell us about retail investor sentiment towards gold because the trading activity includes lots of institutional and hedge fund activity. This activity does not tend to cause GLD gold to trade at a premium or discount to the physical gold market price because it is driven by complex hedging strategies rather than sentiment. Premium or discount pricing tends to happen when retail investors chase gold because there is some big picture story such as covid and its money printing narrative or the Ukraine invasion with its geopolitical narrative dominating the media. When these stories wane retail loses interest and exits its GLD positions. For this reason I also have a second chart which plots the daily change in the GLD RTF gold holdings. The daily changes do not reflect what happened that day because the bankers unwind their GLD long or short positions in batches after they were put on, but the daily holding changes do reveal what was going on with retail sentiment around that time. It is especially useful in showing the duration of retail sentiment in the form of long periods of daily decreases or increases in gold holdings.
I have provided a long term chart of daily GLD holding changes since the GLD ETF's inception to show all past waves of positive and negative retail sentiment, and a short term chart starting with 2018 the provides greater granularity for daily gold holding changes. Just to make it easier for everybody I've circled in red the three key period of positive retail sentiment. The first was in Q2-Q3 of 2020 when the covid pandemic was breaking out. The inflow of gold tracked an uptrend in the price of gold which ended when gold's rally above $2,000 stalled and gold retreated below $2,000. Gold sentiment was weak during 2021 because other themes attracted retail, such as crypto-currencies, meme stocks like Gamestop, energy transition stocks like Tesla, and social media technology.
The next wave of retail interest emerged in Q1-Q2 of 2022 when Russia invaded Ukraine and geopolitical risk dominated the media. Once again retail interest tracked an uptrend in gold which breached $2,000 briefly, confirming once again $2,000 as a ceiling for gold. Retail interest vanished when Federal Reserve Chairman Jerome Powell started increasing interest rates which delivered losses across the board to bond and equity positions. The prospect of a Volcker style shock therapy to tame inflation by inducing a recession dampened retail enthusiasm for gold. The most recent spike in retail gold interest came in March 2023 when Silicon Valley Bank failed, followed by two more regional banks in the United States and Credit Suisse in Switzerland which UBS was forced to absorb.
The SVB bank failure turned into a major learning moment for retail investors when it was explained that while banks deposits are supposed to be available on demand, the cash in fact gets either loaned out or invested in bonds offer a spread between what the bank has to pay the depositor, which until recently has been next to nothing, and what it gets from its loans and bond investments. The arbitrary $250,000 guaranteed amount for a depositor is not a problem for most people, while the rest are smart enough have their surplus savings parked in money market funds. It is a problem, however, for businesses which have to keep a lot more cash on hand to pay for business and payroll expenses, and this turned into a huge problem for the startups that banked at SVB. The government stepped in to stop the contagion by effectively suspending the $250,000 guaranteed cap, but there is still a bank run underway whereby money is being pulled from regional banks and either moved into larger "too big to fail" banks or into money market funds.
The problem is not so much that the banks have their clients' money parked in junk bonds, but more so that they put deposits into long dated T-Bills like the 10 year which in mid 2021 was yielding 1.45% versus 0.04% (next to nothing) for 3 month T-Bills (basically what money market funds yield). Today the 3 month is yielding 5.1% while the 10 year is yielding 3.45%. Because the value of a bond is inversely related to its yield, SVB suffered paper losses on its long duration T-Bill investments. Bank depositors who for a decade received near nothing from their savings deposits are now taking revenge by chasing the higher yield which has almost no paper loss risk because it has such a short term to maturity.
Although there was a flurry of interest in GLD in early March that saw the ETF gain 743,711 ounces from March 13-29 when gold was at $1,965, it has as of April 14 since then lost 560,222 ounces even as gold peaked at $2,048 on April 13. In fact, since gold bottomed at $1,634 on September 27, 2022 the GLD ETF has lost 422,396 ounces of gold even though gold has rallied 25% to its recent peak. There is a stealth gold bull market underway in which the retail investor is not participating. You can see this clearly in the recent flat pattern of the long term GLD holdings chart. The demand driving up the price of gold is coming in the bullion market. Why is there such strong non-retail interest in gold? One explanation is that autocracies thinking hard about the weaponization of the US dollar interfering with their trade are relying more on gold in addition to trying to trade in their partners' currencies. Another may be big money hedging against a hard landing that could trigger a landslide of bank failures in the United States.
And yet another could be the need to raise the US debt ceiling in order to prevent a default. The debt ceiling is an artificial construct which needs to be raised periodically so that spending commitments already approved by Congress can be fulfilled. When the Tea Party Congress used the debt ceiling limit as a tool to blackmail the Obama administration in 2011 with the threat of default by the United States, Obama capitulated and we ended up with a decade of stagnant growth that helped Trump come to power. Trump promptly cranked up the national debt through tax cuts funded by imaginary trickle down theories. Fooled once, Biden will not be fooled twice, and has declared he will not negotiate with the Republican House in order to prevent a default. Even if the Republican House caves in the face of public rage, the inherent nihilism is not going to disappear. $2,000 is destined to become the new base for gold rather than its ceiling. Once the general public comes to believe this we will see a bull market for resource juniors get underway. The key, however, to such a bull market is that the United States, although losing its status as the sole hegemon, does so slowly rather than catastrophically, which will allow gold to rise in real price terms that justifies investing capital exploring for gold deposits and putting ounces in the ground into production. |

Daily Trading Volume and Gold Goldings for GLD ETF |
Long Term Chart of Daily Gold Holding Changes for GLD ETF |
5 year chart for Daily Gold Holding Changes for GLD ETF |
Long Term Chart of 3 mth and 10 year T-Bill Rates |
Tracking the Real Price Gain History of Gold since 1980 |
| Jim (0:12:19): Which of your 2023 Favorites is the best proxy for gold? |
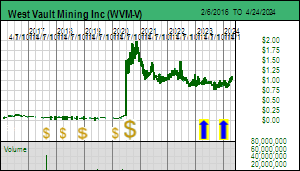
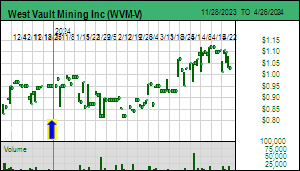
West Vault Mining Inc was made a Good Speculative Value rated KRO Favorite on April 13, 2023 because it is an excellent leveraged proxy for the idea that $2,000 will soon become the base for gold rather than the ceiling it either bumps up against or briefly punches through before retreating to $1,700-$1,800. Last year I had Perpetua Gold Corp as an equivalent proxy for gold establishing a new real high gold price, but demoted it to a Bottom-Fish Spec Value rating at the end of 2022 because of two uncertainties: when will it get off the perpetual permitting treadmill and what will the feasibility study look like after it is updated to reflect the recent cost inflation and whatever changes needed to be made to secure mine approval. My own 20% escalation of CapEx and OpEx applied to the FS model indicated Stibnite will need $2,000 gold to clear key IRR (minimum 15%) and after-tax NPV (equal or higher than CapEx) development hurdles. Given a cycle of gold only temporarily breaching $2,000 Perpetua was no longer a good leveraged proxy for gold at the end of 2022. The permitting process has proceeded beyond the comment period and the stock has responded positively to gold's latest rally above $2,000, but an updated feasibility study is still missing. Furthermore, the large scale of Stibnite and the need for an autoclave to process the refractory ore limits the field of gold producers that might be interested in acquiring Perpetua and developing Stibite, which could hamper the stock's ability to serve as a proxy for gold once a permit is in hand and the feasibility study has been updated.
West Vault already has the key permits in place for developing the Hasbrouck project south of Tonopah in Nevada as two sequentially open pit mined and heap leached gold deposits, and in January 2023 the junior updated the PFS it had delivered in 2016. The reserve numbers are done in the imperial system (short tons and oz per ton) to which the United States clings even though there is much hand-wringing about the math and science competence of Americans which adoption of the metric system would improve. For those who have adapted to thinking about the mining sector in metric terms the total Hasbrouck proven and probable reserve of 44,023,000 tons at 0.017 opt gold is equivalent to 39,936,961 tonnes at 0.58 g/tonne. Tracker April 13, 2023, which is unrestricted because West Vault is a 2023 Favorite, provides an overview of the story and how to treat West Vault as a leveraged proxy for gold.
Since acquiring Hasbrouck in 2014 West Vault has invested $48 million in both acquisition and feasibility demonstration costs. At 60.2 million fully diluted and $1.02 stock price the 100% owned project is valued at $61 million, a mere 27% premium above sunk costs. Three key shareholders led by Peter Palmedo's Sun Valley Gold own 68% of the stock. Nobody seems to have made any money West Vault, which underwent a 10:1 rollback in 2020. The company's stated plan is to treat Hasbrouck as an ounce in the ground gold vault, spending no additional capital on exploration, nor acquiring other projects. The goal is to wait for a mid tier producer to acquire West Vault at fair value. With $4 million working capital West Vault can survive for 4-5 years doing nothing before needing to replenish the treasury with additional equity dilution. A problem with a junior like Perpetua is that the company repeatedly has to refinance, diluting the company at prices which reflect market skepticism that a permit will ever be granted. The absence of equity dilution risk makes West Vault a very good proxy for gold.
Based on the updated PFS which used $1,790/oz as a base case price the stock should be trading in the $1.50-$2.00 to represent fair speculative value, higher if you believe $2,000 is becoming the new base for gold with inflation not getting out of hand. The stock, however, is ignored by the market, perhaps because the 71,000 oz per year output with an 8 year mine life is seen as too small. However, West Vault has left resource expansion potential within the existing property open, and there may be exploration potential to the east which a future acquiror of Hasbrouck may be able to consolidate. The market's unwillingness to assign a higher value to West Vault has prompted the junior to mount a normal course issuer bid to buy up to 2.9 million shares per year. I am not a big fan of juniors using scarce capital to buy their own stock while claiming it is under-valued; that money is better spent on marketing the story to a broader audience.
I have dumped the PFS data into my own DCF model which emulates the ore mining schedule and depreciation-depletion schedules as closely as possible. The result at the base case prices is about 10% lower than the PFS IRR and NPV figures, possibly because I am not including tax pools related to the sunk cost. But it is close enough to serve as a tool to see what happens at different gold prices while keeping the silver base case price of $22.50/oz constant. One chart shows how after-tax NPV in USD behaves at both 5% and 10% discount rates all the way to $3,000 per oz. Using higher gold prices is not worth the bother because circumstances that allow such a price increase likely involve significant cost inflation, which makes a DCF model that keeps costs fixed an inappropriate tool. The second chart converts the USD NPV into CAD and presents it on a per fully diluted share basis. These figures would decline if the Canadian dollar soars against the US dollar, which we did see in 2007 and 2011 when CAD achieved parity with USD and even was worth more for a short period. If the Republican Party refuses to increase the debt ceiling in 2023 this might happen again, though the decline of the USD against CAD will likely be more than offset by a substantial surge in the price of gold. The key reason to use these charts to figure out where West Vault could trade is the fact that fully diluted is unlikely to change over the next few years.
It is important to keep in mind that under the rational speculation model a project at the permitting-feasibility stage should be priced at 50%-75% of its indicated after tax NPV. However, if the metal is in an uptrend which the market believes is establishing a new pricing reality, such as we witnessed with base metals during the China super cycle of the 2000s, the market will not stick to rational valuation metrics. West Vault offers Good Speculative Value because the market does not believe $2,000 will become the new base for gold rather than its ceiling. |
West Vault Mining Inc (WVM-V)


Favorite
Good Spec Value |
 |
 |
| Hasbrouck |
United States - Nevada |
7-Permitting & Feasibility |
Au Ag |
Maps showing location of West Vault's Hasbrouck Project |
Maps showing Expansion Potential at Three Hills and Hasbrouck Deposits |
Hasbrouck AT NPV Sensitivity to Gold Price |
Hasbrouck CAD AT NPV per share Sensitivity to Gold Price |
| Jim (0:24:34): While yellow gold struggles to make $2,000 its new base, how far will white gold fall before it hits bottom? |
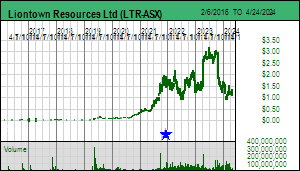
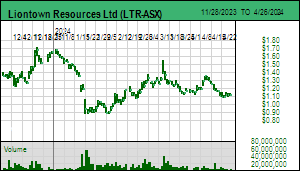
The plunge in the price of lithium carbonate has accelerated in recent weeks like that of a bungee jumper who has not yet reached the point where the bungee rope begins to stretch to slow the fall. At $12.32/lb on April 14, 2023 the price is approaching the lower end of the $10-$15/lb range where lithium prices need to be in order to mobilize the supply required to fulfill the 2030 goals for the energy transition. Oddly, since Liontown Resource Ltd revealed that Albemarle had offered AUD $2.50 per share or AUD $5.5 billion on unacceptable conditional terms rejected by Liontown, the stock has risen to the $2.70 level.
The question now mesmerizing the market is whether the lithium price free-fall will result in a kersplat below $3/lb as it did in 2018-2020 in the wake of Lithium Mania 1.0 which got underway in 2015, or reach a limit around $10 and rebound in the manner of a bungee jumper whose rope stretched just enough to prevent smashing into a dry riverbed. Lithium Mania 2.0, which is the scramble outside Australia to identify and acquire potential lithium enriched pegmatites that could feed the second half the projected 600% supply expansion required for 2030 EV goals, is still active at the corporate level, though investors have paused, wondering if this will be a bust as it was in 2018-2020.
The $30-$35/lb range in which Lithium carbonate spent 2022 was never a sustainable price range, and most lithium supply delivered in 2022 was done at much lower prices contracted earlier. But contracts were running out, and as the Australian producers expanded output, the question emerged as to what should long term contract prices be set at? Doing them substantially lower than spot prices would not sit well with shareholders, and while the battery and car makers can eat the spot price of procuring their marginal needs, doing long term contracts at the 2022 elevated prices was not good for the business model, nor for policy goals whose actualization do require the future price of EVs to be within reach of the masses.
In early December when lithium carbonate was still at $36/lb I started reading in one of the daily metals publications to which I subscribe about how there was developing weakness in demand for lithium carbonate. This became a drumbeat that seemed to precede declines. There was all this talk about Q1 being a slow period for EV construction. In China there was the disappearance of EV subsidies to worry about. And there was hand-wringing about a weak Chinese economic rebound after scrapping the zero-covid policy. The rising interest rates in the rest of the world created talk about hard landings and recessions on the horizon. This narrative also applied to the magnet rare earths for which demand had also softened, both for the light rare earths neodymium and praseodymium, and the heavy rare earths dysprosium and terbium. And yet there were all these announcements about new battery factory plans everywhere including in China. And then in mid April we started hearing how Chinese exports in Q1 of 2023 were up smartly. And maybe the Chinese economy was rebounding quite well from zero-covid whose immediate after-math had to be shrouded in secrecy to prevent Xi Jinping from getting flack over all the covid deaths that happened since the end of zero-covid.
Was there perhaps a collective decision by end users to stand back and draw down their inventory so as to take some air out of the lithium carbonate price? While the big producers like Pilbara and Albemarle would have liked to continue to collect windfall revenues from elevated lithium prices, it really was not in their long term interest to see just about every LCT enriched pegmatite to be in the money, including all those claystone deposits Elon Musk thinks will feed his gigafactories. I've included the price-grade rock value matrix to remind people that $10-$15/lb lithium carbonate is still highly lucrative for pegmatites grading 1% Li2O or more. Between $5-$10/lb it is still lucrative for the better pegmatites, but the claystone projects start losing their margin for error. I suspect during the next few weeks this lithium bungee plunge will have reached a limit, and as the market stops holding its breath, we will see Lithium Mania 2.0 catch fire as investors embrace white gold. If at the same time we see $2,000 emerge as the new base for gold rather than the ceiling, the combination of white gold and yellow gold bull markets will result in 2023 becoming a year when the PDAC Curse gets violated. |
Liontown Resources Ltd (LTR-ASX)
Unrated Spec Value |
 |
 |
| Kathleen Valley |
Australia - Western Australia |
8-Construction |
Li Ta |
Lithium Carbonate Price Chart - A Bungee Plunge to Behold! |
Lithium Grade and Lithium Carbonate Price Matrix for Rock Value |
Still time for the PDAC Curse to be violated in 2023 |
| Disclosure: JK does not own any of the companies mentioned; West Vault Mining is a Good Spec Value rated Favorite |