Home / Research Tools
Research Tools
| | Corporate Profile: Rainy River Resources Ltd
Publisher: Kaiser Research Online
Author: Copyright 2013 John A Kaiser
|
| |
Rainy River Resources Ltd (RR-T)
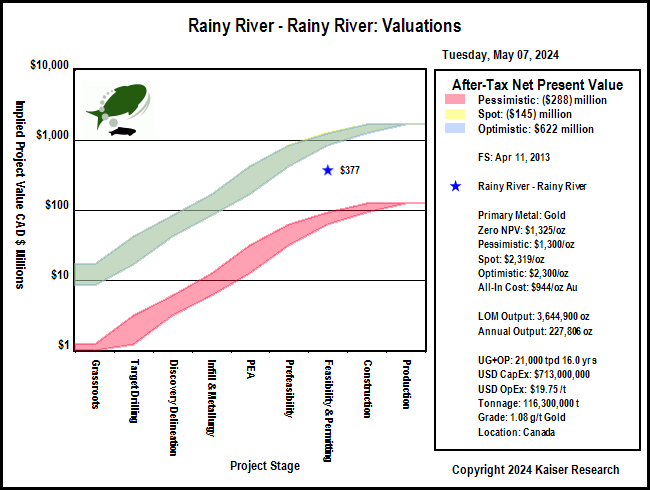
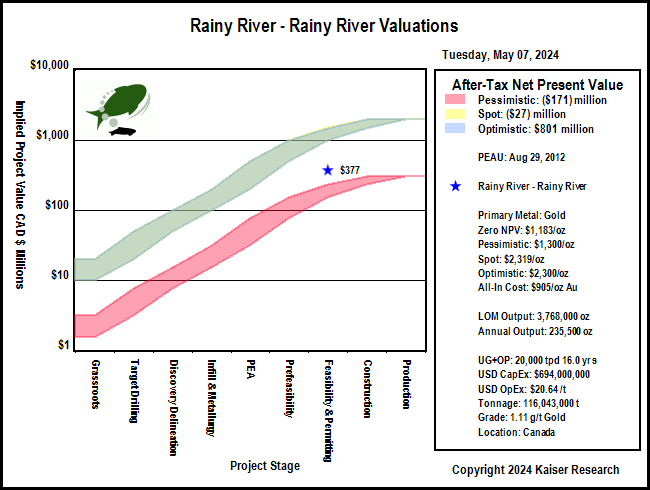
| Led by CEO and President Raymond Threlkeld, Rainy River is focused on its 26,000 hectare Rainy River project in Northwestern Ontario where it is attempting to outline deposits mineable by both open pit and underground methods. Acquired in June 2005 from Nuinsco as a property hosting three known mineralized zones, Rainy River has identified a number of additional zones and in February 2008 completed resource estimates including the 17/ODM Zones, Beaver Pond Area, the 433 Zone and the CAP Zone identifying 1.4 million indicated gold ounces and an additional 2.2 million inferred ounces. By February 2012 the resource had grown to 5.72 million measured and indicated gold ounces, with 2.25 million inferred. A PEA completed in November 2011 for a 13 year combined open-pit and underground operation with a 31,000 TPD mill reported a pretax NPV(5%) of $786 million and an IRR of 19.4% using a gold price of $1,200. LOM production is forecast at 329,000 gold ounces annually, with average cash costs of $417 per ounce net of silver credits. An updated PEA filed in August 2012 offered a scaled back mining scenario of 20,000 tpd which blends open and underground ore averaging 305,000 oz gold and 478,000 oz silver during the initial 10 years. A PFS is expected in the first half of 2013. In May 2013 the company announced it had agreed to be acquired by New Gold for, at the election of each holder of Rainy River common shares, 0.5 of a common share of New Gold or $3.83 in cash. The offer values the fully diluted in-the-money share capital of Rainy River, net of Rainy River's current cash balance, at approximately $310-million. |
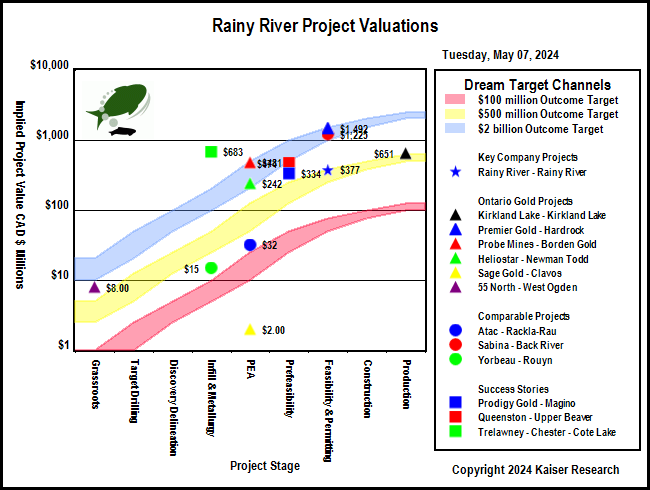
Key to Understanding IPV Charts and Spec Value Hunter Tables
| An IPV Chart is a graphical presentation of a Spec Value Hunter table that has been constructed according to the Rational Speculation Model developed by John Kaiser. The IPV Chart allows speculators to identify which projects offer poor, fair or good speculative value in both absolute and relative terms. The speculative value depends on the project stage, the project's implied value as calculated by the company's fully diluted capitalization, stock price and net project interest, and the dream target deemed appropriate for the project. A dream target is what a project would be worth in discounted cash flow terms once in production. |
| Green background indicates the dream target judged appropriate for this play by John Kaiser - otherwise unranked. |
Poor Speculative Value -   |
Fair Speculative Value -  |
Good Speculative Value -   |
| Note: narrow arrows indicate IPV is outside the fair value channel but within 25% of the fair value limits |
| Click on the company name to view the company profile, the project name to view project details. |
| Click on the project icon if its background is shaded to get the IPV Chart for that company. |
| Rainy River |  | 100% WI | Canada | 7-Permitting & Feasibility |
|---|
| Rainy River 43-101 Economic Study (USD except where noted otherwise) |
| FS | May 23, 2013 |
| BBA Inc | Rainy River |
| Mining Scenario | TR | Mining Costs |
| Mining Type: | UG+OP |
| Cost Currency: | USD |
| Processing Type: |
|
| Capital Cost: | $713,000,000 |
| Operating Rate: | 21,000 tpd |
| Sustaining Cost: | $485,000,000 |
| Operating Days: | 365 |
| Operating Cost: | $19.75/t |
| Strip Rate: | 2.8 |
| BC Cash Cost per Unit: USD | $665/oz Au |
| Mine Life: | 16 years |
| BC Cash Cost Net By-Products: USD | $619/oz Au |
| LOM Tonnage: | 116,300,000 t |
| BC All-In Cost Net By-Prod: USD | $948/oz Au |
| Est Startup: |
|
| Spot All-In Cost Net By-Prod: USD | $963/oz Au |
| Production Potential |
| Metal 1 | Metal 2 | Metal 3 | Metal 4 |
| Metal: | Au | Ag |
|
|
| Grade: | 1.08 g/t | 2.76 g/t |
|
|
| Recovery: | 90.1% | 64.1% |
|
|
| Annual Output: | 227,806 oz | 413,450 oz |
|
|
| LOM Output: | 3,644,900 oz | 6,615,200 oz |
|
|
| Base Case Price: | $1,400/oz | $25.00/oz |
|
|
| Spot Price: | $1,315/oz | $16.47/oz |
|
|
| Base Case NSR: | $41.61/t | $1.35/t |
|
|
| Spot NSR: | $39.08/t | $0.89/t |
|
|
| Base Case Valuation |
| Reported Valuation Currency: | USD |
| Pre-Tax NPV: | $1,296,300,000 |
| Discount Rate: | 5% |
| After-Tax NPV: | $931,000,000 |
| Total Base Case NSR USD: | $42.96/t |
| Pre-Tax IRR: | 28% |
| Total Spot NSR USD: | $39.97/t |
| After-Tax IRR: | 24% |
| Annual Pre-Tax Cash Flow Base Case and Net CF/FDSH USD: | $177,881,250 | $1.34 | Pre-Tax Payback: | 3.1 y |
| Annual Pre-Tax Cash Flow Spot and Net CF/FDSH USD: | $155,002,381 | $1.13 | After-Tax Payback: | 3.2 y |
| Enterprise Value CAD : | $303,689,909 | $2.76/sh | Share Price: | $3.42 |
| Note: 2.5% NSR |
| Comparative Valuations using Life of Mine Averages |
| Discount Rate: | 0% | 5% | 10% | 15% |
| Base Case Pre-Tax NPV USD: | $1,648,100,000 | $844,110,578 | $401,395,368 | $144,051,302 |
| Base Case Pre-Tax Net NPV/Sh USD: | $14.95 | $7.66 | $3.64 | $1.31 |
| Premium BC PT NPV over EV: | $12.81 | $5.52 | $1.50 | ($0.84) |
| Spot Pre-Tax NPV USD: | $1,282,038,089 | $607,962,088 | $238,670,269 | $25,593,769 |
| Spot Pre-Tax Net NPV/Sh: | $11.63 | $5.52 | $2.17 | $0.23 |
| Premium Spot PT NPV over EV USD: | $9.49 | $3.37 | $0.02 | ($1.91) |
| The comparative NPV calculations assume constant annual cash flow based on the life of mine average annual payable production and CapEx spent in year one. The operating cost includes the LOM sustaining capital. Due to details such as ore scheduling these NPV figures may differ from those of the 43-101 economic study. |
| After-Tax Valuations using Spot By-Product Prices |
 |
 |
| Rainy River 43-101 Economic Study (USD except where noted otherwise) |
| PEAU | Aug 29, 2012 |
| BBA Inc | Rainy River |
| Mining Scenario | TR | Mining Costs |
| Mining Type: | UG+OP |
| Cost Currency: | USD |
| Processing Type: |
|
| Capital Cost: | $694,000,000 |
| Operating Rate: | 20,000 tpd |
| Sustaining Cost: | $488,000,000 |
| Operating Days: | 365 |
| Operating Cost: | $20.64/t |
| Strip Rate: | 2.5 |
| BC Cash Cost per Unit: USD | $640/oz Au |
| Mine Life: | 16 years |
| BC Cash Cost Net By-Products: USD | $595/oz Au |
| LOM Tonnage: | 116,043,000 t |
| BC All-In Cost Net By-Prod: USD | $909/oz Au |
| Est Startup: | e 2016, H1 |
| Spot All-In Cost Net By-Prod: USD | $924/oz Au |
| Production Potential |
| Metal 1 | Metal 2 | Metal 3 | Metal 4 |
| Metal: | Au | Ag |
|
|
| Grade: | 1.11 g/t | 2.70 g/t |
|
|
| Recovery: | 91.0% | 67.4% |
|
|
| Annual Output: | 235,500 oz | 421,875 oz |
|
|
| LOM Output: | 3,768,000 oz | 6,750,000 oz |
|
|
| Base Case Price: | $1,250/oz | $25.00/oz |
|
|
| Spot Price: | $1,315/oz | $16.47/oz |
|
|
| Base Case NSR: | $40.33/t | $1.44/t |
|
|
| Spot NSR: | $42.42/t | $0.95/t |
|
|
| Base Case Valuation |
| Reported Valuation Currency: | USD |
| Pre-Tax NPV: | $846,000,000 |
| Discount Rate: | 5% |
| After-Tax NPV: |
|
| Total Base Case NSR USD: | $41.77/t |
| Pre-Tax IRR: | 21% |
| Total Spot NSR USD: | $43.38/t |
| After-Tax IRR: |
|
| Annual Pre-Tax Cash Flow Base Case and Net CF/FDSH USD: | $154,249,875 | $1.12 | Pre-Tax Payback: | 3.8 y |
| Annual Pre-Tax Cash Flow Spot and Net CF/FDSH USD: | $165,970,556 | $1.23 | After-Tax Payback: |
|
| Enterprise Value CAD : | $303,689,909 | $2.76/sh | Share Price: | $3.42 |
| Note: |
| Comparative Valuations using Life of Mine Averages |
| Discount Rate: | 0% | 5% | 10% | 15% |
| Base Case Pre-Tax NPV USD: | $1,285,998,000 | $616,354,884 | $249,257,242 | $37,248,540 |
| Base Case Pre-Tax Net NPV/Sh USD: | $11.67 | $5.59 | $2.26 | $0.34 |
| Premium BC PT NPV over EV: | $9.52 | $3.45 | $0.12 | ($1.80) |
| Spot Pre-Tax NPV USD: | $1,473,528,900 | $737,332,067 | $332,620,147 | $97,933,487 |
| Spot Pre-Tax Net NPV/Sh: | $13.37 | $6.69 | $3.02 | $0.89 |
| Premium Spot PT NPV over EV USD: | $11.23 | $4.55 | $0.88 | ($1.25) |
| The comparative NPV calculations assume constant annual cash flow based on the life of mine average annual payable production and CapEx spent in year one. The operating cost includes the LOM sustaining capital. Due to details such as ore scheduling these NPV figures may differ from those of the 43-101 economic study. |
| After-Tax Valuations using Spot By-Product Prices |
 |
 |
| Rainy River 43-101 Economic Study (USD except where noted otherwise) |
| PEA | Dec 23, 2011 |
| BBA Inc | Rainy River |
| Mining Scenario | TR | Mining Costs |
| Mining Type: | UG+OP |
| Cost Currency: | USD |
| Processing Type: |
|
| Capital Cost: | $681,000,000 |
| Operating Rate: | 31,340 tpd |
| Sustaining Cost: | $774,700,000 |
| Operating Days: | 365 |
| Operating Cost: | $8.12/t |
| Strip Rate: | 3.3 |
| BC Cash Cost per Unit: USD | $337/oz Au |
| Mine Life: | 13 years |
| BC Cash Cost Net By-Products: USD | $301/oz Au |
| LOM Tonnage: | 129,090,000 t |
| BC All-In Cost Net By-Prod: USD | $701/oz Au |
| Est Startup: | 2015, H2 |
| Spot All-In Cost Net By-Prod: USD | $714/oz Au |
| Production Potential |
| Metal 1 | Metal 2 | Metal 3 | Metal 4 |
| Metal: | Au | Ag |
|
|
| Grade: | 0.99 g/t | 1.99 g/t |
|
|
| Recovery: | 88.5% | 65.0% |
|
|
| Annual Output: | 275,483 oz | 397,670 oz |
|
|
| LOM Output: | 3,636,376 oz | 5,368,547 oz |
|
|
| Base Case Price: | $1,200/oz | $25.00/oz |
|
|
| Spot Price: | $1,315/oz | $16.47/oz |
|
|
| Base Case NSR: | $28.90/t | $0.87/t |
|
|
| Spot NSR: | $31.67/t | $0.57/t |
|
|
| Base Case Valuation |
| Reported Valuation Currency: | USD |
| Pre-Tax NPV: | $786,000,000 |
| Discount Rate: | 5% |
| After-Tax NPV: |
|
| Total Base Case NSR USD: | $29.77/t |
| Pre-Tax IRR: | 19% |
| Total Spot NSR USD: | $32.24/t |
| After-Tax IRR: |
|
| Annual Pre-Tax Cash Flow Base Case and Net CF/FDSH USD: | $247,635,858 | $1.71 | Pre-Tax Payback: | 3.4 y |
| Annual Pre-Tax Cash Flow Spot and Net CF/FDSH USD: | $275,938,052 | $1.96 | After-Tax Payback: |
|
| Enterprise Value CAD : | $303,689,909 | $2.76/sh | Share Price: | $3.42 |
| Note: |
| Comparative Valuations using Life of Mine Averages |
| Discount Rate: | 0% | 5% | 10% | 15% |
| Base Case Pre-Tax NPV USD: | $1,763,566,154 | $1,033,715,061 | $595,218,472 | $320,760,674 |
| Base Case Pre-Tax Net NPV/Sh USD: | $16.00 | $9.38 | $5.40 | $2.91 |
| Premium BC PT NPV over EV: | $13.86 | $7.24 | $3.26 | $0.77 |
| Spot Pre-Tax NPV USD: | $2,131,494,677 | $1,286,913,848 | $777,982,623 | $458,165,290 |
| Spot Pre-Tax Net NPV/Sh: | $19.34 | $11.67 | $7.06 | $4.16 |
| Premium Spot PT NPV over EV USD: | $17.19 | $9.53 | $4.92 | $2.01 |
| The comparative NPV calculations assume constant annual cash flow based on the life of mine average annual payable production and CapEx spent in year one. The operating cost includes the LOM sustaining capital. Due to details such as ore scheduling these NPV figures may differ from those of the 43-101 economic study. |
| After-Tax Valuations using Spot By-Product Prices |
 |
 |
|
| |
| | You can return to the Top of this page
|
|