Home / Research Tools
Research Tools
| | Corporate Profile: Atna Resources Ltd
Publisher: Kaiser Research Online
Author: Copyright 2009 John A Kaiser
|
| |
Atna Resources Ltd (ATN-T)
| Atna Resources Ltd, led by Chairman David Watkins and CEO James Hesketh, is focused on precious metals in the United States. Atna's former flagship, the Pinson gold deposit in Nevada that hosts a 2.7 million gold ounce resource, was optioned 70% to Barrick for $30 million in exploration spending. In March 2008 Atna completed a merger with Canyon Resources and took over Canyon's advanced Briggs and Reward projects that it subsequently placed into production. An updated mine plan for the Briggs mine located in Inyo County, California, released in February 2009, calls for production of 40,000 - 50,000 ounces annually over a six year mine life, with life-of-mine cash costs of $468 per gold ounce and production starting in the first half of 2009. Gold production from Reward, combined with production at the Briggs mine which declared commercial production in February 2010 with production of 80 ounces per day at cash costs in the $600-$650 range, would yield the company an annual gold production rate of 70,000 to 90,000 ounces should both mines achieve production. In 2011 Atna also re-acquired from Barrick a 100% interest in Pinson, minus the surrounding exploration ground which Barrick is retaining, and intends to commence an underground mining operation at Pinson during the 4th Quarter of 2012. |

Key to Understanding IPV Charts and Spec Value Hunter Tables
| An IPV Chart is a graphical presentation of a Spec Value Hunter table that has been constructed according to the Rational Speculation Model developed by John Kaiser. The IPV Chart allows speculators to identify which projects offer poor, fair or good speculative value in both absolute and relative terms. The speculative value depends on the project stage, the project's implied value as calculated by the company's fully diluted capitalization, stock price and net project interest, and the dream target deemed appropriate for the project. A dream target is what a project would be worth in discounted cash flow terms once in production. |
| Green background indicates the dream target judged appropriate for this play by John Kaiser - otherwise unranked. |
Poor Speculative Value -   |
Fair Speculative Value -  |
Good Speculative Value -   |
| Note: narrow arrows indicate IPV is outside the fair value channel but within 25% of the fair value limits |
| Click on the company name to view the company profile, the project name to view project details. |
| Click on the project icon if its background is shaded to get the IPV Chart for that company. |
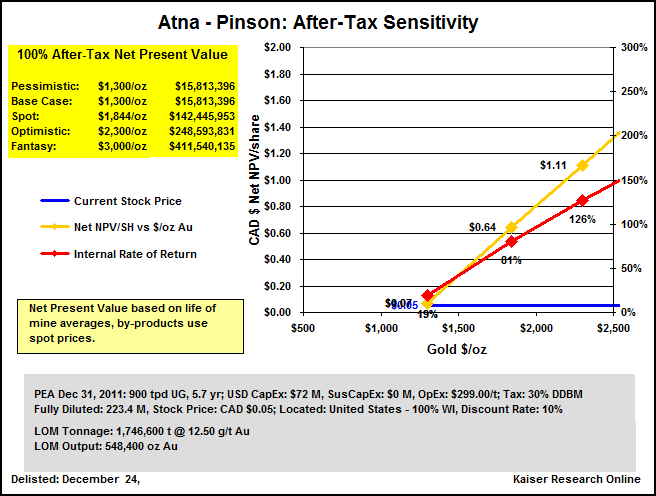
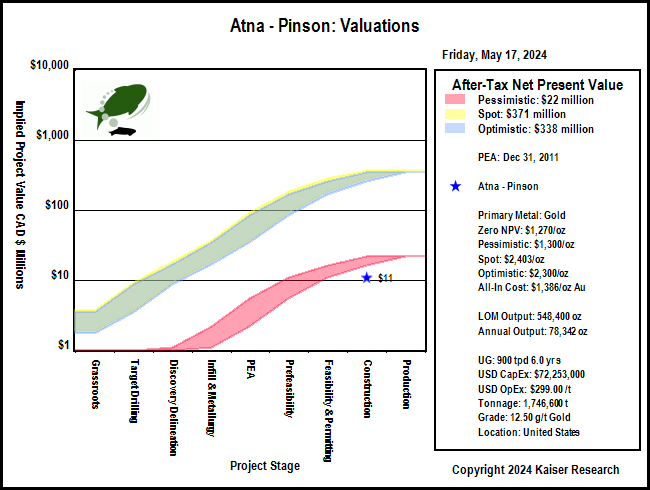
| Pinson |  | 100% WI | United States | 8-Construction |
|---|
| Pinson 43-101 Economic Study (USD except where noted otherwise) |
| PEA | Dec 31, 2011 |
| Gustavson | Pinson |
| Mining Scenario | TR | Mining Costs |
| Mining Type: | UG |
| Cost Currency: | USD |
| Processing Type: |
|
| Capital Cost: | $72,253,000 |
| Operating Rate: | 900 tpd |
| Sustaining Cost: | $0 |
| Operating Days: | 365 |
| Operating Cost: | $299.00/t |
| Strip Rate: |
|
| BC Cash Cost per Unit: USD | $1,254/oz Au |
| Mine Life: | 6 years |
| BC Cash Cost Net By-Products: USD | $1,254/oz Au |
| LOM Tonnage: | 1,746,600 t |
| BC All-In Cost Net By-Prod: USD | $1,386/oz Au |
| Est Startup: | 2012, Q4 |
| Spot All-In Cost Net By-Prod: USD | $1,386/oz Au |
| Production Potential |
| Metal 1 | Metal 2 | Metal 3 | Metal 4 |
| Metal: | Au |
|
|
|
| Grade: | 12.50 g/t |
|
|
|
| Recovery: | 87.0% |
|
|
|
| Annual Output: | 78,342 oz |
|
|
|
| LOM Output: | 548,400 oz |
|
|
|
| Base Case Price: | $1,300/oz |
|
|
|
| Spot Price: | $1,315/oz |
|
|
|
| Base Case NSR: | $310.03/t |
|
|
|
| Spot NSR: | $313.62/t |
|
|
|
| Base Case Valuation |
| Reported Valuation Currency: | USD |
| Pre-Tax NPV: | $91,100,000 |
| Discount Rate: | 5% |
| After-Tax NPV: |
|
| Total Base Case NSR USD: | $310.03/t |
| Pre-Tax IRR: | 103% |
| Total Spot NSR USD: | $313.62/t |
| After-Tax IRR: |
|
| Annual Pre-Tax Cash Flow Base Case and Net CF/FDSH USD: | $3,623,100 | $0.02 | Pre-Tax Payback: | 2.2 y |
| Annual Pre-Tax Cash Flow Spot and Net CF/FDSH USD: | $4,802,147 | $0.02 | After-Tax Payback: |
|
| Enterprise Value CAD : | $45,064,345 | $.20/sh | Share Price: | $0.05 |
| Note: |
| Comparative Valuations using Life of Mine Averages |
| Discount Rate: | 0% | 5% | 10% | 15% |
| Base Case Pre-Tax NPV USD: | ($50,514,400) | ($51,298,343) | ($51,339,505) | ($50,905,601) |
| Base Case Pre-Tax Net NPV/Sh USD: | ($0.23) | ($0.23) | ($0.23) | ($0.23) |
| Premium BC PT NPV over EV: | ($0.38) | ($0.39) | ($0.39) | ($0.38) |
| Spot Pre-Tax NPV USD: | ($43,440,117) | ($45,598,838) | ($46,671,270) | ($47,025,528) |
| Spot Pre-Tax Net NPV/Sh: | ($0.19) | ($0.20) | ($0.21) | ($0.21) |
| Premium Spot PT NPV over EV USD: | ($0.35) | ($0.36) | ($0.37) | ($0.37) |
| The comparative NPV calculations assume constant annual cash flow based on the life of mine average annual payable production and CapEx spent in year one. The operating cost includes the LOM sustaining capital. Due to details such as ore scheduling these NPV figures may differ from those of the 43-101 economic study. |
| After-Tax Valuations using Spot By-Product Prices |
 |
 |
| Briggs |  | 100% WI | United States | 9-Production |
|---|
| Briggs 43-101 Economic Study (USD except where noted otherwise) |
| FSU | Mar 30, 2009 |
| Chlumsky, Armbrust, and Meyer | Briggs |
| Mining Scenario | TR | Mining Costs |
| Mining Type: | OP |
| Cost Currency: | USD |
| Processing Type: | heap leach |
| Capital Cost: | $14,500,000 |
| Operating Rate: | 7,000 tpd |
| Sustaining Cost: | $11,400,000 |
| Operating Days: | 365 |
| Operating Cost: | $9.15/t |
| Strip Rate: | 2.2 |
| BC Cash Cost per Unit: USD | $578/oz Au |
| Mine Life: | 6 years |
| BC Cash Cost Net By-Products: USD | $578/oz Au |
| LOM Tonnage: | 11,308,248 t |
| BC All-In Cost Net By-Prod: USD | $706/oz Au |
| Est Startup: | e2009, Q3 |
| Spot All-In Cost Net By-Prod: USD | $706/oz Au |
| Production Potential |
| Metal 1 | Metal 2 | Metal 3 | Metal 4 |
| Metal: | Au |
|
|
|
| Grade: | 0.72 g/t |
|
|
|
| Recovery: | 93.4% |
|
|
|
| Annual Output: | 40,478 oz |
|
|
|
| LOM Output: | 202,394 oz |
|
|
|
| Base Case Price: | $750/oz |
|
|
|
| Spot Price: | $1,315/oz |
|
|
|
| Base Case NSR: | $11.88/t |
|
|
|
| Spot NSR: | $20.83/t |
|
|
|
| Base Case Valuation |
| Reported Valuation Currency: | USD |
| Pre-Tax NPV: | $84,400,000 |
| Discount Rate: | 5% |
| After-Tax NPV: |
|
| Total Base Case NSR USD: | $11.88/t |
| Pre-Tax IRR: | 58% |
| Total Spot NSR USD: | $20.83/t |
| After-Tax IRR: |
|
| Annual Pre-Tax Cash Flow Base Case and Net CF/FDSH USD: | $6,980,250 | $0.02 | Pre-Tax Payback: |
|
| Annual Pre-Tax Cash Flow Spot and Net CF/FDSH USD: | $29,852,344 | $0.13 | After-Tax Payback: |
|
| Enterprise Value CAD : | $45,064,345 | $.20/sh | Share Price: | $0.05 |
| Note: |
| Comparative Valuations using Life of Mine Averages |
| Discount Rate: | 0% | 5% | 10% | 15% |
| Base Case Pre-Tax NPV USD: | $15,981,500 | $10,748,366 | $6,932,557 | $4,109,668 |
| Base Case Pre-Tax Net NPV/Sh USD: | $0.07 | $0.05 | $0.03 | $0.02 |
| Premium BC PT NPV over EV: | ($0.09) | ($0.11) | ($0.13) | ($0.14) |
| Spot Pre-Tax NPV USD: | $153,214,063 | $121,311,895 | $97,490,677 | $79,378,402 |
| Spot Pre-Tax Net NPV/Sh: | $0.69 | $0.54 | $0.44 | $0.36 |
| Premium Spot PT NPV over EV USD: | $0.53 | $0.39 | $0.28 | $0.20 |
| The comparative NPV calculations assume constant annual cash flow based on the life of mine average annual payable production and CapEx spent in year one. The operating cost includes the LOM sustaining capital. Due to details such as ore scheduling these NPV figures may differ from those of the 43-101 economic study. |
| After-Tax Valuations using Spot By-Product Prices |
 |
 |
| Columbia |  | 100% WI | United States | 5-PEA |
|---|
| Columbia 43-101 Economic Study (USD except where noted otherwise) |
| PEA | May 10, 2010 |
| Gustavson | Columbia |
| Mining Scenario | TR | Mining Costs |
| Mining Type: | OP |
| Cost Currency: | USD |
| Processing Type: | gravity/FL |
| Capital Cost: | $72,200,000 |
| Operating Rate: | 4,500 tpd |
| Sustaining Cost: | $0 |
| Operating Days: | 350 |
| Operating Cost: | $28.55/t |
| Strip Rate: | 3.1 |
| BC Cash Cost per Unit: USD | $646/oz Au |
| Mine Life: | 9 years |
| BC Cash Cost Net By-Products: USD | $627/oz Au |
| LOM Tonnage: | 12,791,520 t |
| BC All-In Cost Net By-Prod: USD | $742/oz Au |
| Est Startup: |
|
| Spot All-In Cost Net By-Prod: USD | $738/oz Au |
| Production Potential |
| Metal 1 | Metal 2 | Metal 3 | Metal 4 |
| Metal: | Au | Ag |
|
|
| Grade: | 1.49 g/t | 3.98 g/t |
|
|
| Recovery: | 92.0% | 70.0% |
|
|
| Annual Output: | 69,646 oz | 96,524 oz |
|
|
| LOM Output: | 626,817 oz | 868,716 oz |
|
|
| Base Case Price: | $850/oz | $13.50/oz |
|
|
| Spot Price: | $1,315/oz | $16.47/oz |
|
|
| Base Case NSR: | $37.59/t | $0.83/t |
|
|
| Spot NSR: | $58.15/t | $1.01/t |
|
|
| Base Case Valuation |
| Reported Valuation Currency: | USD |
| Pre-Tax NPV: | $27,300,000 |
| Discount Rate: | 5% |
| After-Tax NPV: |
|
| Total Base Case NSR USD: | $38.41/t |
| Pre-Tax IRR: | 11% |
| Total Spot NSR USD: | $59.16/t |
| After-Tax IRR: |
|
| Annual Pre-Tax Cash Flow Base Case and Net CF/FDSH USD: | $15,535,924 | $0.07 | Pre-Tax Payback: | 5.5 y |
| Annual Pre-Tax Cash Flow Spot and Net CF/FDSH USD: | $48,211,473 | $0.22 | After-Tax Payback: |
|
| Enterprise Value CAD : | $45,064,345 | $.20/sh | Share Price: | $0.05 |
| Note: |
| Comparative Valuations using Life of Mine Averages |
| Discount Rate: | 0% | 5% | 10% | 15% |
| Base Case Pre-Tax NPV USD: | $67,623,316 | $36,406,264 | $15,701,597 | $1,679,100 |
| Base Case Pre-Tax Net NPV/Sh USD: | $0.30 | $0.16 | $0.07 | $0.01 |
| Premium BC PT NPV over EV: | $0.15 | $0.01 | ($0.09) | ($0.15) |
| Spot Pre-Tax NPV USD: | $361,703,253 | $257,598,619 | $186,773,653 | $137,256,598 |
| Spot Pre-Tax Net NPV/Sh: | $1.62 | $1.15 | $0.84 | $0.61 |
| Premium Spot PT NPV over EV USD: | $1.46 | $1.00 | $0.68 | $0.46 |
| The comparative NPV calculations assume constant annual cash flow based on the life of mine average annual payable production and CapEx spent in year one. The operating cost includes the LOM sustaining capital. Due to details such as ore scheduling these NPV figures may differ from those of the 43-101 economic study. |
| After-Tax Valuations using Spot By-Product Prices |
 |
 |
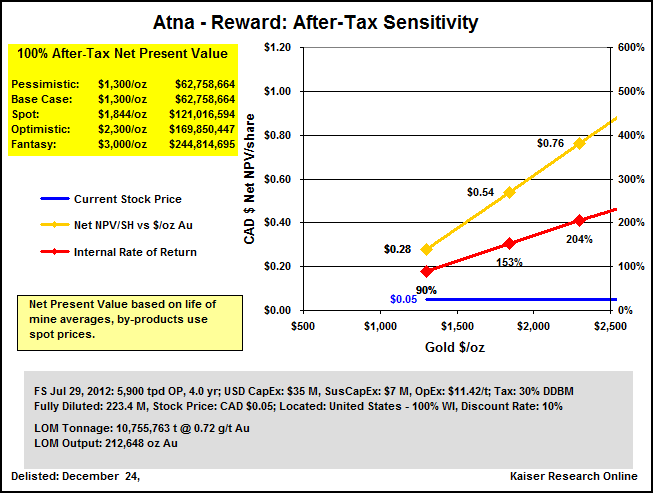
| Reward |
| 100% WI | United States | 8-Construction |
|---|
| Reward 43-101 Economic Study (USD except where noted otherwise) |
| FS | Jul 29, 2012 |
| Chlumsky, Armbrust, and Meyer | Reward |
| Mining Scenario | TR | Mining Costs |
| Mining Type: | OP |
| Cost Currency: | USD |
| Processing Type: | HL |
| Capital Cost: | $34,500,000 |
| Operating Rate: | 5,900 tpd |
| Sustaining Cost: | $6,900,000 |
| Operating Days: | 365 |
| Operating Cost: | $11.42/t |
| Strip Rate: | 3.1 |
| BC Cash Cost per Unit: USD | $810/oz Au |
| Mine Life: | 6 years |
| BC Cash Cost Net By-Products: USD | $810/oz Au |
| LOM Tonnage: | 10,755,763 t |
| BC All-In Cost Net By-Prod: USD | $1,004/oz Au |
| Est Startup: |
|
| Spot All-In Cost Net By-Prod: USD | $1,004/oz Au |
| Production Potential |
| Metal 1 | Metal 2 | Metal 3 | Metal 4 |
| Metal: | Au |
|
|
|
| Grade: | 0.72 g/t |
|
|
|
| Recovery: | 80.0% |
|
|
|
| Annual Output: | 30,378 oz |
|
|
|
| LOM Output: | 212,648 oz |
|
|
|
| Base Case Price: | $1,300/oz |
|
|
|
| Spot Price: | $1,315/oz |
|
|
|
| Base Case NSR: | $18.34/t |
|
|
|
| Spot NSR: | $18.55/t |
|
|
|
| Base Case Valuation |
| Reported Valuation Currency: | USD |
| Pre-Tax NPV: | $68,582,000 |
| Discount Rate: | 5% |
| After-Tax NPV: |
|
| Total Base Case NSR USD: | $18.34/t |
| Pre-Tax IRR: | 48% |
| Total Spot NSR USD: | $18.55/t |
| After-Tax IRR: |
|
| Annual Pre-Tax Cash Flow Base Case and Net CF/FDSH USD: | $14,898,430 | $0.06 | Pre-Tax Payback: | 2.3 y |
| Annual Pre-Tax Cash Flow Spot and Net CF/FDSH USD: | $15,355,619 | $0.06 | After-Tax Payback: |
|
| Enterprise Value CAD : | $45,064,345 | $.20/sh | Share Price: | $0.05 |
| Note: |
| Comparative Valuations using Life of Mine Averages |
| Discount Rate: | 0% | 5% | 10% | 15% |
| Base Case Pre-Tax NPV USD: | $47,990,580 | $33,602,664 | $23,070,906 | $15,244,083 |
| Base Case Pre-Tax Net NPV/Sh USD: | $0.21 | $0.15 | $0.10 | $0.07 |
| Premium BC PT NPV over EV: | $0.06 | ($0.01) | ($0.05) | ($0.09) |
| Spot Pre-Tax NPV USD: | $50,733,713 | $35,812,712 | $24,881,067 | $16,748,625 |
| Spot Pre-Tax Net NPV/Sh: | $0.23 | $0.16 | $0.11 | $0.07 |
| Premium Spot PT NPV over EV USD: | $0.07 | $0.00 | ($0.05) | ($0.08) |
| The comparative NPV calculations assume constant annual cash flow based on the life of mine average annual payable production and CapEx spent in year one. The operating cost includes the LOM sustaining capital. Due to details such as ore scheduling these NPV figures may differ from those of the 43-101 economic study. |
| After-Tax Valuations using Spot By-Product Prices |
 |
 |
|
| |
| | You can return to the Top of this page
|
|