Home / Research Tools
Research Tools
| | Corporate Profile: Hathor Exploration Ltd
Publisher: Kaiser Research Online
Author: Copyright 2009 John A Kaiser
|
| |
Hathor Exploration Ltd (HAT-T)
| Hathor Exploration Ltd. is a junior uranium company run by CEO Stephen Stanley that is focused on exploration projects on the eastern side of the Athabasca Basin of Northern Saskatchewan. Hathor has acquired a large and strategic land package in close proximity to the producing properties of Cameco and AREVA, and its Midwest Northeast Project, where drill results yielding anomalous uranium mineralization were first announced in February 2008, has emerged as one of the most promising discoveries by a uranium junior in recent years and included results such as 11 meters of 5% U308,15 meters of 10% U308, and longer intersections such as 46 meters of 3.25% U308. Hathor is currently engaged in infill drilling of the deposit. In July 2009 Hathor made a takeover bid for Northern Continental Uranium, offering 0.1389 Hathor share per NCR share. In April 2011 Hathor announced an agreement to acquire Terra Ventures, its JV partner in the Roughrider deposit, in an all share transaction where Terra shareholders receive 0.20 of a Hathor share per share. In August 2011 Hathor received a $3.75 per share cash takeover offer from Cameco, valuing the company at approximately $520-million. In October 2011 Rio Tinto made a separate takeover offer of $4.15 cash per share, a $578 million value, and on November 14th Cameco increased its offer to $4.50, with Rio raising its own offer to $4.70 on November 17th, which became the final, winning offer. Hathor was delisted on January 12, 2012. |

Key to Understanding IPV Charts and Spec Value Hunter Tables
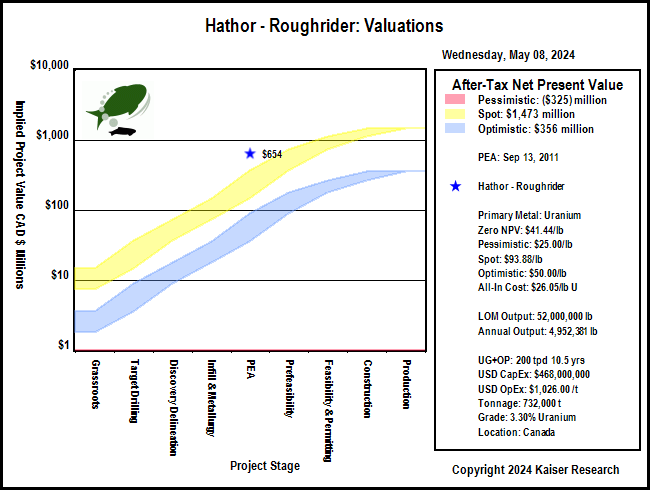
| An IPV Chart is a graphical presentation of a Spec Value Hunter table that has been constructed according to the Rational Speculation Model developed by John Kaiser. The IPV Chart allows speculators to identify which projects offer poor, fair or good speculative value in both absolute and relative terms. The speculative value depends on the project stage, the project's implied value as calculated by the company's fully diluted capitalization, stock price and net project interest, and the dream target deemed appropriate for the project. A dream target is what a project would be worth in discounted cash flow terms once in production. |
| Green background indicates the dream target judged appropriate for this play by John Kaiser - otherwise unranked. |
Poor Speculative Value -   |
Fair Speculative Value -  |
Good Speculative Value -   |
| Note: narrow arrows indicate IPV is outside the fair value channel but within 25% of the fair value limits |
| Click on the company name to view the company profile, the project name to view project details. |
| Click on the project icon if its background is shaded to get the IPV Chart for that company. |
| Roughrider |  | 100% WI | Canada | 5-PEA |
|---|
| Roughrider 43-101 Economic Study (USD except where noted otherwise) |
| PEA | Sep 13, 2011 |
| SRK Consulting | Roughrider |
| Mining Scenario | TR | Mining Costs |
| Mining Type: | UG+OP |
| Cost Currency: | USD |
| Processing Type: |
|
| Capital Cost: | $468,000,000 |
| Operating Rate: | 200 tpd |
| Sustaining Cost: | $100,000,000 |
| Operating Days: | 365 |
| Operating Cost: | $1,026.00/t |
| Strip Rate: | 5.3 |
| BC Cash Cost per Unit: USD | $15.12/lb U |
| Mine Life: | 11 years |
| BC Cash Cost Net By-Products: USD | $15.12/lb U |
| LOM Tonnage: | 732,000 t |
| BC All-In Cost Net By-Prod: USD | $26.05/lb U |
| Est Startup: |
|
| Spot All-In Cost Net By-Prod: USD | $26.05/lb U |
| Production Potential |
| Metal 1 | Metal 2 | Metal 3 | Metal 4 |
| Metal: | U |
|
|
|
| Grade: | 3.30% |
|
|
|
| Recovery: | 96.0% |
|
|
|
| Annual Output: | 4,952,381 lb |
|
|
|
| LOM Output: | 52,000,000 lb |
|
|
|
| Base Case Price: | $60.00/lb |
|
|
|
| Spot Price: | $21.30/lb |
|
|
|
| Base Case NSR: | $4,070.45/t |
|
|
|
| Spot NSR: | $1,445.01/t |
|
|
|
| Base Case Valuation |
| Reported Valuation Currency: | USD |
| Pre-Tax NPV: | $769,000,000 |
| Discount Rate: | 7% |
| After-Tax NPV: |
|
| Total Base Case NSR USD: | $4,070.45/t |
| Pre-Tax IRR: | 32% |
| Total Spot NSR USD: | $1,445.01/t |
| After-Tax IRR: |
|
| Annual Pre-Tax Cash Flow Base Case and Net CF/FDSH USD: | $222,244,860 | $1.52 | Pre-Tax Payback: | 2.2 y |
| Annual Pre-Tax Cash Flow Spot and Net CF/FDSH USD: | $30,587,715 | $0.15 | After-Tax Payback: |
|
| Enterprise Value CAD : | $630,344,513 | $4.53/sh | Share Price: | $4.70 |
| Note: |
| Comparative Valuations using Life of Mine Averages |
| Discount Rate: | 0% | 5% | 10% | 15% |
| Base Case Pre-Tax NPV USD: | $1,654,448,600 | $1,115,141,475 | $760,138,896 | $519,311,169 |
| Base Case Pre-Tax Net NPV/Sh USD: | $11.89 | $8.01 | $5.46 | $3.73 |
| Premium BC PT NPV over EV: | $8.36 | $4.49 | $1.94 | $0.21 |
| Spot Pre-Tax NPV USD: | ($262,122,847) | ($294,311,543) | ($310,452,183) | ($317,108,713) |
| Spot Pre-Tax Net NPV/Sh: | ($1.88) | ($2.11) | ($2.23) | ($2.28) |
| Premium Spot PT NPV over EV USD: | ($5.40) | ($5.63) | ($5.75) | ($5.80) |
| The comparative NPV calculations assume constant annual cash flow based on the life of mine average annual payable production and CapEx spent in year one. The operating cost includes the LOM sustaining capital. Due to details such as ore scheduling these NPV figures may differ from those of the 43-101 economic study. |
| After-Tax Valuations using Spot By-Product Prices |
 |
 |
|
| |
| | You can return to the Top of this page
|
|