Home / Research Tools
Research Tools
| | Corporate Profile: Khan Resources Inc
Publisher: Kaiser Research Online
Author: Copyright 2013 John A Kaiser
|
| |
Khan Resources Inc (KRI-T)
| Khan Resources Inc is a a former Mongolia focused uranium junior which spent $40 million on a feasibility study for its 58% owned Dornod uranium project in Mongolia where it had established an inferred resource of 55 million pounds of U308 at grades of 0.15%. On July 15, 2009 a Mongolian government branch canceled a key license, and in November 2009 Khan received a hostile $0.65 bid from ARMZ, part of Russia's Rosatom, which owned a 21% stake in CAUC, the JV entity in which Khan owned 58% and the Mongolian government 21%. The license was reinstated in January 2010 and in February 2010 Khan agreed to a $0.96 bid from CNNC, a Chinese nuclear agency, which did not sit well with the Mongolian authorities. ARMZ let its bid expire, contending that the underlying license was invalid, and on April 13, 2010 the Mongolian Nuclear Energy Agency declared the license invalid. CNNC withdrew its bid on May 21, 2010 after supposedly not getting reulatory approval from China's National Energy Adminsitration. The Mongolian government subsequently entered a development arrangement with ARMZ, prompting Khan on August 20, 2010 to launch a lawsuit against ARMZ seeking $300 million in damages. On January 10, 2011 Khan launched an international arbitration action against the Mongolian government seeking $200 million compensation for the expropriation of the Dornod license. The largest remaining shareholder is Laramide Resources Inc, whose head Marc Henderson has several successful litigation victories to his record (for Kinburai on Sadiola against IAMGOLD, and for Aquiline on Navidad against IMA). On May 11, 2012 the TSX decided Khan no longer met TSX listing requirements, and Khan chose to relist on the CNSX on May 14, 2012 with the symbol KRI. Because KRO does not cover CNSX listings Khan's trading activity is no longer tracked. |

Key to Understanding IPV Charts and Spec Value Hunter Tables
| An IPV Chart is a graphical presentation of a Spec Value Hunter table that has been constructed according to the Rational Speculation Model developed by John Kaiser. The IPV Chart allows speculators to identify which projects offer poor, fair or good speculative value in both absolute and relative terms. The speculative value depends on the project stage, the project's implied value as calculated by the company's fully diluted capitalization, stock price and net project interest, and the dream target deemed appropriate for the project. A dream target is what a project would be worth in discounted cash flow terms once in production. |
| Green background indicates the dream target judged appropriate for this play by John Kaiser - otherwise unranked. |
Poor Speculative Value -   |
Fair Speculative Value -  |
Good Speculative Value -   |
| Note: narrow arrows indicate IPV is outside the fair value channel but within 25% of the fair value limits |
| Click on the company name to view the company profile, the project name to view project details. |
| Click on the project icon if its background is shaded to get the IPV Chart for that company. |
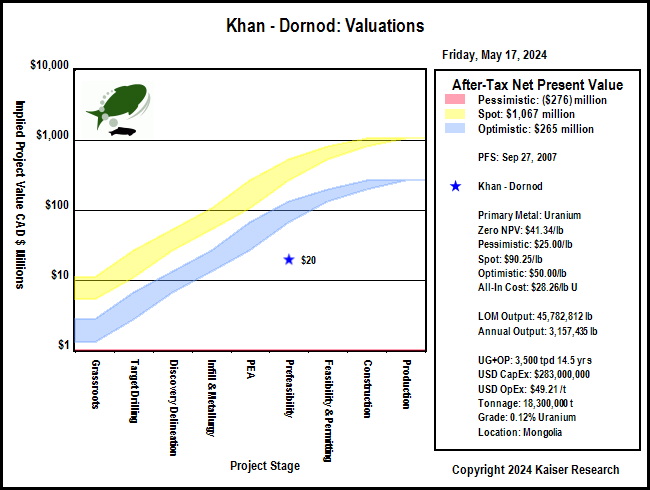
| Dornod |  | 58% WI | Mongolia | 6-Prefeasibility |
|---|
| Dornod 43-101 Economic Study (USD except where noted otherwise) |
| PFS | Sep 27, 2007 |
| Scott Wilson RPA | Dornod |
| Mining Scenario | TR | Mining Costs |
| Mining Type: | UG+OP |
| Cost Currency: | USD |
| Processing Type: |
|
| Capital Cost: | $283,000,000 |
| Operating Rate: | 3,500 tpd |
| Sustaining Cost: | $99,149,000 |
| Operating Days: | 365 |
| Operating Cost: | $49.21/t |
| Strip Rate: |
|
| BC Cash Cost per Unit: USD | $19.91/lb U3O8 |
| Mine Life: | 15 years |
| BC Cash Cost Net By-Products: USD | $19.91/lb U3O8 |
| LOM Tonnage: | 18,300,000 t |
| BC All-In Cost Net By-Prod: USD | $28.26/lb U3O8 |
| Est Startup: |
|
| Spot All-In Cost Net By-Prod: USD | $28.26/lb U3O8 |
| Production Potential |
| Metal 1 | Metal 2 | Metal 3 | Metal 4 |
| Metal: | U |
|
|
|
| Grade: | 0.12% |
|
|
|
| Recovery: | 93.0% |
|
|
|
| Annual Output: | 3,157,435 lb |
|
|
|
| LOM Output: | 45,782,812 lb |
|
|
|
| Base Case Price: | $55.00/lb |
|
|
|
| Spot Price: | $21.30/lb |
|
|
|
| Base Case NSR: | $135.94/t |
|
|
|
| Spot NSR: | $52.64/t |
|
|
|
| Base Case Valuation |
| Reported Valuation Currency: | USD |
| Pre-Tax NPV: | $363,100,000 |
| Discount Rate: | 8% |
| After-Tax NPV: |
|
| Total Base Case NSR USD: | $135.94/t |
| Pre-Tax IRR: | 37% |
| Total Spot NSR USD: | $52.64/t |
| After-Tax IRR: |
|
| Annual Pre-Tax Cash Flow Base Case and Net CF/FDSH USD: | $110,793,150 | $0.82 | Pre-Tax Payback: | 4.5 y |
| Annual Pre-Tax Cash Flow Spot and Net CF/FDSH USD: | $4,387,591 | ($0.02) | After-Tax Payback: |
|
| Enterprise Value CAD : | $7,913,586 | $.11/sh | Share Price: | $0.16 |
| Note: |
| Comparative Valuations using Life of Mine Averages |
| Discount Rate: | 0% | 5% | 10% | 15% |
| Base Case Pre-Tax NPV USD: | $1,168,955,100 | $708,189,265 | $437,279,183 | $270,166,557 |
| Base Case Pre-Tax Net NPV/Sh USD: | $9.29 | $5.63 | $3.47 | $2.15 |
| Premium BC PT NPV over EV: | $9.20 | $5.54 | $3.39 | $2.06 |
| Spot Pre-Tax NPV USD: | ($320,722,733) | ($294,925,428) | ($275,317,635) | ($259,499,557) |
| Spot Pre-Tax Net NPV/Sh: | ($2.55) | ($2.34) | ($2.19) | ($2.06) |
| Premium Spot PT NPV over EV USD: | ($2.63) | ($2.43) | ($2.27) | ($2.15) |
| The comparative NPV calculations assume constant annual cash flow based on the life of mine average annual payable production and CapEx spent in year one. The operating cost includes the LOM sustaining capital. Due to details such as ore scheduling these NPV figures may differ from those of the 43-101 economic study. |
| After-Tax Valuations using Spot By-Product Prices |
 |
 |
|
| |
| | You can return to the Top of this page
|
|