Home / Research Tools
Research Tools
| | Corporate Profile: Brazauro Resources Corp
Publisher: Kaiser Research Online
Author: Copyright 2009 John A. Kaiser
|
| |
Brazauro Resources Corp (BZO-V)
| Brazauro Resources Corp is a Mark Jones junior focused on gold exploration in Brazil where it discovered its flagship Tocantinzinho deposit in the Tapajos district in 2004. After dealing with a title problem affecting part of the discovery that emerged in early 2006, Brazauro reported an initial resource of 1.6 million ounces in late 2006. An updated resource in September 2007 reported an indicated and inferred sulphide resource of 52,117,000 tonnes of 1.25 g/t representing 2.1 million ounces gold amenable to an open pit mining and milling scenario. Eldorado optioned up to 75% of Tocantinzho in July 2008 on terms that required it to invest $8.4 million in Brazauro stock, spend $9.5 million over 2 years, and pay up to $100 million in stages. Eldorado initiated a feasibility study in late 2008 In addition Eldorado secured a right of first refusal on any other Brazilian projects acquired by Brazauro, in effect making Brazauro its Brazilian project generation arm. The geological brains behind Brazauro are Len Krol and Elton Pereira while investment banking support comes from founder Mark Jones and Harry Dobson. Brazauro is independently exploring the Bom Jardim project optioned from Gold Fields and the 100% optioned Piranhas project. In May 2010 Brazauro agreed to be acquired for 0.067 Eldorado share per BZO share, representing a stock price of $1.33 or a transaction value of $122 million. Shareholders will also receive shares in a spin-out of Brazauro's exploration properties, minus Agua Branca and Piranhas which are being acquired by Eldorado. |

Key to Understanding IPV Charts and Spec Value Hunter Tables
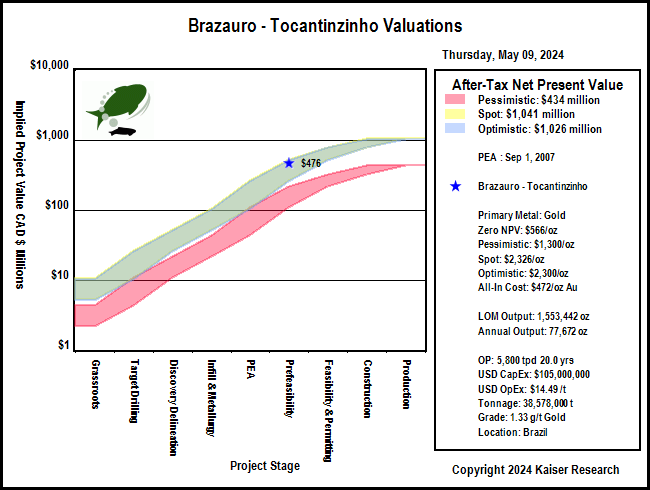
| An IPV Chart is a graphical presentation of a Spec Value Hunter table that has been constructed according to the Rational Speculation Model developed by John Kaiser. The IPV Chart allows speculators to identify which projects offer poor, fair or good speculative value in both absolute and relative terms. The speculative value depends on the project stage, the project's implied value as calculated by the company's fully diluted capitalization, stock price and net project interest, and the dream target deemed appropriate for the project. A dream target is what a project would be worth in discounted cash flow terms once in production. |
| Green background indicates the dream target judged appropriate for this play by John Kaiser - otherwise unranked. |
Poor Speculative Value -   |
Fair Speculative Value -  |
Good Speculative Value -   |
| Note: narrow arrows indicate IPV is outside the fair value channel but within 25% of the fair value limits |
| Click on the company name to view the company profile, the project name to view project details. |
| Click on the project icon if its background is shaded to get the IPV Chart for that company. |
| Tocantinzinho |  | 25% TC | Brazil | 6-Prefeasibility |
|---|
| Tocantinzinho 43-101 Economic Study (USD except where noted otherwise) |
| PEA | Mar 1, 2010 |
| NCL Brasil Ltda. | Tocantinzinho |
| Mining Scenario | TR | Mining Costs |
| Mining Type: | OP |
| Cost Currency: | USD |
| Processing Type: |
|
| Capital Cost: | $239,000,000 |
| Operating Rate: | 11,500 tpd |
| Sustaining Cost: | $83,000,000 |
| Operating Days: | 365 |
| Operating Cost: | $18.47/t |
| Strip Rate: |
|
| BC Cash Cost per Unit: USD | $579/oz Au |
| Mine Life: | 13 years |
| BC Cash Cost Net By-Products: USD | $579/oz Au |
| LOM Tonnage: | 48,138,000 t |
| BC All-In Cost Net By-Prod: USD | $763/oz Au |
| Est Startup: |
|
| Spot All-In Cost Net By-Prod: USD | $763/oz Au |
| Production Potential |
| Metal 1 | Metal 2 | Metal 3 | Metal 4 |
| Metal: | Au |
|
|
|
| Grade: | 1.24 g/t |
|
|
|
| Recovery: | 90.0% |
|
|
|
| Annual Output: | 134,000 oz |
|
|
|
| LOM Output: | 1,742,000 oz |
|
|
|
| Base Case Price: | $900/oz |
|
|
|
| Spot Price: | $1,315/oz |
|
|
|
| Base Case NSR: | $28.73/t |
|
|
|
| Spot NSR: | $41.98/t |
|
|
|
| Base Case Valuation |
| Reported Valuation Currency: | USD |
| Pre-Tax NPV: |
|
| Discount Rate: | 5% |
| After-Tax NPV: | $128,893,000 |
| Total Base Case NSR USD: | $28.73/t |
| Pre-Tax IRR: |
|
| Total Spot NSR USD: | $41.98/t |
| After-Tax IRR: | 12% |
| Annual Pre-Tax Cash Flow Base Case and Net CF/FDSH USD: | $43,072,175 | $0.09 | Pre-Tax Payback: |
|
| Annual Pre-Tax Cash Flow Spot and Net CF/FDSH USD: | $98,688,875 | $0.24 | After-Tax Payback: | 6.3 y |
| Enterprise Value CAD : | $115,129,833 | $1.19/sh | Share Price: | $1.23 |
| Note: |
| Comparative Valuations using Life of Mine Averages |
| Discount Rate: | 0% | 5% | 10% | 15% |
| Base Case Pre-Tax NPV USD: | $237,938,275 | $100,597,399 | $19,640,731 | ($29,711,272) |
| Base Case Pre-Tax Net NPV/Sh USD: | $0.61 | $0.26 | $0.05 | ($0.08) |
| Premium BC PT NPV over EV: | ($0.31) | ($0.67) | ($0.87) | ($1.00) |
| Spot Pre-Tax NPV USD: | $960,955,375 | $598,158,857 | $378,790,941 | $240,302,823 |
| Spot Pre-Tax Net NPV/Sh: | $2.48 | $1.55 | $0.98 | $0.62 |
| Premium Spot PT NPV over EV USD: | $1.56 | $0.62 | $0.05 | ($0.30) |
| The comparative NPV calculations assume constant annual cash flow based on the life of mine average annual payable production and CapEx spent in year one. The operating cost includes the LOM sustaining capital. Due to details such as ore scheduling these NPV figures may differ from those of the 43-101 economic study. |
| After-Tax Valuations using Spot By-Product Prices |
 |
 |
| Tocantinzinho 43-101 Economic Study (USD except where noted otherwise) |
| PEAU | Dec 1, 2007 |
| NCL Brasil Ltda. | Tocantinzinho |
| Mining Scenario | TR | Mining Costs |
| Mining Type: | OP |
| Cost Currency: | USD |
| Processing Type: |
|
| Capital Cost: | $128,300,000 |
| Operating Rate: | 8,000 tpd |
| Sustaining Cost: | $24,827,000 |
| Operating Days: | 365 |
| Operating Cost: | $7.13/t |
| Strip Rate: | 2.8 |
| BC Cash Cost per Unit: USD | $170/oz Au |
| Mine Life: | 13 years |
| BC Cash Cost Net By-Products: USD | $170/oz Au |
| LOM Tonnage: | 38,550,000 t |
| BC All-In Cost Net By-Prod: USD | $266/oz Au |
| Est Startup: |
|
| Spot All-In Cost Net By-Prod: USD | $266/oz Au |
| Production Potential |
| Metal 1 | Metal 2 | Metal 3 | Metal 4 |
| Metal: | Au |
|
|
|
| Grade: | 1.41 g/t |
|
|
|
| Recovery: | 91.0% |
|
|
|
| Annual Output: | 122,600 oz |
|
|
|
| LOM Output: | 1,596,711 oz |
|
|
|
| Base Case Price: | $550/oz |
|
|
|
| Spot Price: | $1,315/oz |
|
|
|
| Base Case NSR: | $23.09/t |
|
|
|
| Spot NSR: | $55.21/t |
|
|
|
| Base Case Valuation |
| Reported Valuation Currency: | USD |
| Pre-Tax NPV: | $42,000,000 |
| Discount Rate: | 5% |
| After-Tax NPV: |
|
| Total Base Case NSR USD: | $23.09/t |
| Pre-Tax IRR: | 10% |
| Total Spot NSR USD: | $55.21/t |
| After-Tax IRR: |
|
| Annual Pre-Tax Cash Flow Base Case and Net CF/FDSH USD: | $46,610,400 | $0.12 | Pre-Tax Payback: |
|
| Annual Pre-Tax Cash Flow Spot and Net CF/FDSH USD: | $140,405,530 | $0.36 | After-Tax Payback: |
|
| Enterprise Value CAD : | $115,129,833 | $1.19/sh | Share Price: | $1.23 |
| Note: 5% NSR |
| Comparative Valuations using Life of Mine Averages |
| Discount Rate: | 0% | 5% | 10% | 15% |
| Base Case Pre-Tax NPV USD: | $452,808,200 | $277,712,988 | $172,022,275 | $105,452,340 |
| Base Case Pre-Tax Net NPV/Sh USD: | $1.17 | $0.72 | $0.44 | $0.27 |
| Premium BC PT NPV over EV: | $0.24 | ($0.21) | ($0.48) | ($0.65) |
| Spot Pre-Tax NPV USD: | $1,672,144,890 | $1,116,828,607 | $777,713,383 | $560,819,291 |
| Spot Pre-Tax Net NPV/Sh: | $4.32 | $2.89 | $2.01 | $1.45 |
| Premium Spot PT NPV over EV USD: | $3.39 | $1.96 | $1.08 | $0.52 |
| The comparative NPV calculations assume constant annual cash flow based on the life of mine average annual payable production and CapEx spent in year one. The operating cost includes the LOM sustaining capital. Due to details such as ore scheduling these NPV figures may differ from those of the 43-101 economic study. |
| After-Tax Valuations using Spot By-Product Prices |
 |
 |
| Tocantinzinho 43-101 Economic Study (USD except where noted otherwise) |
| PEA | Sep 1, 2007 |
| NCL Brasil Ltda. | Tocantinzinho |
| Mining Scenario | TR | Mining Costs |
| Mining Type: | OP |
| Cost Currency: | USD |
| Processing Type: |
|
| Capital Cost: | $105,000,000 |
| Operating Rate: | 5,800 tpd |
| Sustaining Cost: | $15,164,000 |
| Operating Days: | 365 |
| Operating Cost: | $14.49/t |
| Strip Rate: |
|
| BC Cash Cost per Unit: USD | $395/oz Au |
| Mine Life: | 20 years |
| BC Cash Cost Net By-Products: USD | $395/oz Au |
| LOM Tonnage: | 38,578,000 t |
| BC All-In Cost Net By-Prod: USD | $472/oz Au |
| Est Startup: |
|
| Spot All-In Cost Net By-Prod: USD | $472/oz Au |
| Production Potential |
| Metal 1 | Metal 2 | Metal 3 | Metal 4 |
| Metal: | Au |
|
|
|
| Grade: | 1.33 g/t |
|
|
|
| Recovery: | 94.0% |
|
|
|
| Annual Output: | 77,672 oz |
|
|
|
| LOM Output: | 1,553,442 oz |
|
|
|
| Base Case Price: | $550/oz |
|
|
|
| Spot Price: | $1,315/oz |
|
|
|
| Base Case NSR: | $20.18/t |
|
|
|
| Spot NSR: | $48.25/t |
|
|
|
| Base Case Valuation |
| Reported Valuation Currency: | USD |
| Pre-Tax NPV: |
|
| Discount Rate: | 5% |
| After-Tax NPV: | $34,521,000 |
| Total Base Case NSR USD: | $20.18/t |
| Pre-Tax IRR: |
|
| Total Spot NSR USD: | $48.25/t |
| After-Tax IRR: | 8% |
| Annual Pre-Tax Cash Flow Base Case and Net CF/FDSH USD: | $12,044,270 | $0.03 | Pre-Tax Payback: |
|
| Annual Pre-Tax Cash Flow Spot and Net CF/FDSH USD: | $71,467,234 | $0.18 | After-Tax Payback: | 4.0 y |
| Enterprise Value CAD : | $115,129,833 | $1.19/sh | Share Price: | $1.23 |
| Note: |
| Comparative Valuations using Life of Mine Averages |
| Discount Rate: | 0% | 5% | 10% | 15% |
| Base Case Pre-Tax NPV USD: | $120,721,400 | $33,951,789 | ($8,104,840) | ($29,875,432) |
| Base Case Pre-Tax Net NPV/Sh USD: | $0.31 | $0.09 | ($0.02) | ($0.08) |
| Premium BC PT NPV over EV: | ($0.61) | ($0.84) | ($0.95) | ($1.00) |
| Spot Pre-Tax NPV USD: | $1,309,180,672 | $739,229,381 | $451,805,330 | $293,557,634 |
| Spot Pre-Tax Net NPV/Sh: | $3.38 | $1.91 | $1.17 | $0.76 |
| Premium Spot PT NPV over EV USD: | $2.46 | $0.98 | $0.24 | ($0.17) |
| The comparative NPV calculations assume constant annual cash flow based on the life of mine average annual payable production and CapEx spent in year one. The operating cost includes the LOM sustaining capital. Due to details such as ore scheduling these NPV figures may differ from those of the 43-101 economic study. |
| After-Tax Valuations using Spot By-Product Prices |
 |
 |
|
| |
| | You can return to the Top of this page
|
|