Hello Guest User, You are visiting this website from a computer with an IP address of 172.71.254.44 with the name of '?' since Sat May 4, 2024 at 8:15:24 AM PT for approx. 0 minutes now.
Led by CEO Glenn Laing and Chairman Herbert Abrahamson, St. Andrew has three principal properties, the Aquarius and Holloway-Holt feasibility stage properties in Ontario with measured and indicated gold resources of two million ounces, and the 150,000 ounce permitting-stage Nixon Fork property in Alaska. St. Andrew also holds a 17% interest in Apollo Gold.
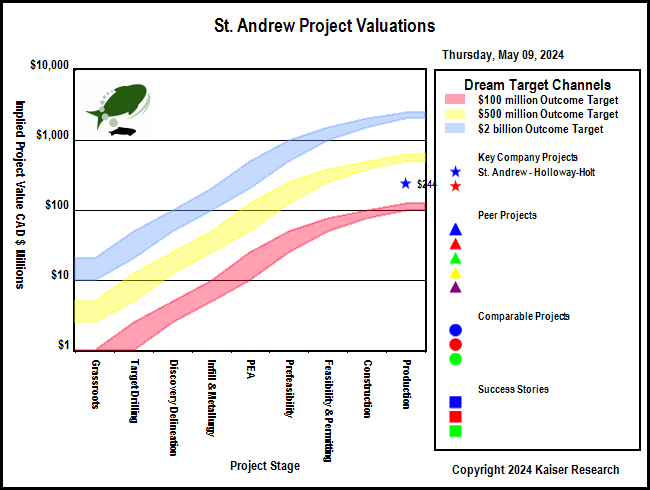
Key to Understanding IPV Charts and Spec Value Hunter Tables
An IPV Chart is a graphical presentation of a Spec Value Hunter table that has been constructed according to the Rational Speculation Model developed by John Kaiser. The IPV Chart allows speculators to identify which projects offer poor, fair or good speculative value in both absolute and relative terms. The speculative value depends on the project stage, the project's implied value as calculated by the company's fully diluted capitalization, stock price and net project interest, and the dream target deemed appropriate for the project. A dream target is what a project would be worth in discounted cash flow terms once in production.
Green background indicates the dream target judged appropriate for this play by John Kaiser - otherwise unranked.
Poor Speculative Value -
Fair Speculative Value -
Good Speculative Value -
Note: narrow arrows indicate IPV is outside the fair value channel but within 25% of the fair value limits
Click on the company name to view the company profile, the project name to view project details.
Click on the project icon if its background is shaded to get the IPV Chart for that company.